What Problem Does Naturgy Solve?
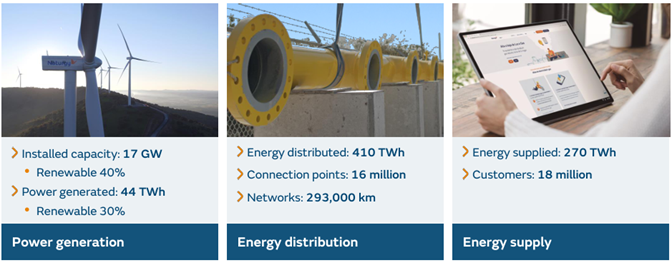
Naturgy Energy Group, S.A. is a regulated utility that specializes in processing, transporting, and distributing natural gas. It is one of the largest gas utilities in Europe. Also, it has the biggest liquefied natural gas business, including the highest number of LNG import terminals. The company is also involved in the production and distribution of electricity.
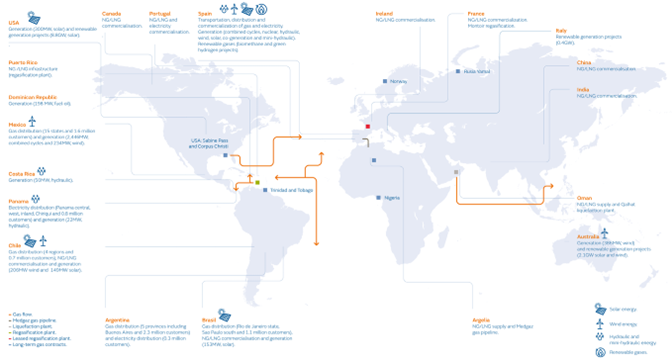
The company is headquartered in Madrid, Spain, but it operates in 24 countries around the world. Naturgy is Spain’s leading natural gas company and third-largest electricity supplier, with 180 years of history in the energy sector. On average, in 2023, the company had 7,073 employees (a 1.9% drop from 2022).
Naturgy is a member of the Utilities equity sector. It operates in the Natural Gas Transmission and Distribution and Electrical Power Generation industries. Naturgy’s shares trade publicly on the Spanish stock exchange and have a market cap of EUR 23.65 billion.
Naturgy’s activities span four business areas:
- “Purchase, transportation and distribution of natural gas – 386,479 GWh distributed in 2022 through a network of 136,272 km of pipeline;
- Production and distribution of electricity – 47,029 GWh produced and 34,033 GWh distributed through a network of 155,060 km of electricity transmission and distribution lines;
- Transportation and sale of liquefied natural gas;
- Management and operation of gas and electricity infrastructures.”
These activities are grouped into two business segments: Energy Markets and Distribution Networks.
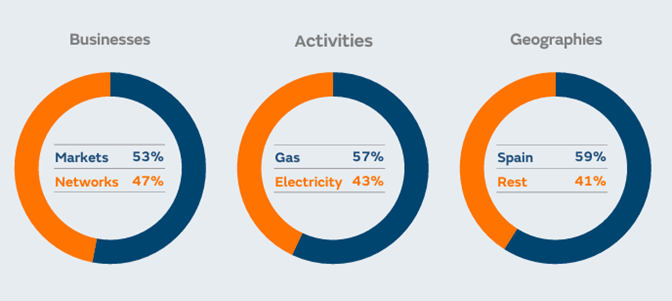
As of April 2024, Spain accounts for 59% of Naturgy’s profits (i.e., EBITDA). The rest of the world (23 countries) accounts for 41%. The firm makes 53% of its earnings in the Energy Markets and 47% in the Distribution Networks. Its gas-related activities earn 57% of its profits, whereas 43% comes from its electricity-related activities.
How Does Naturgy Earn Money?
Naturgy’s Business Model
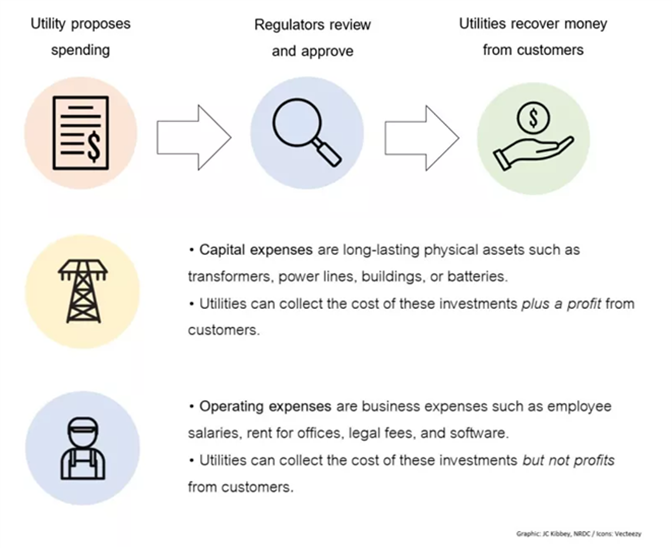
Naturgy runs on the longstanding utility business model. It profits by investing in the gas and electricity production and distribution infrastructure/networks that provide gas and electricity to customers. The company is a regulated monopoly. So, it is only permitted to supply gas and electricity to customers within its geographic areas of operation.
In exchange, it is allowed to recover its costs. But it can only profit from its capital/infrastructure investment (e.g., energy infrastructure costs). It cannot profit from its operating expenses (business expenses like staff salaries, office rentals, etc.), which it can only recoup.
The Big Income Picture for Naturgy
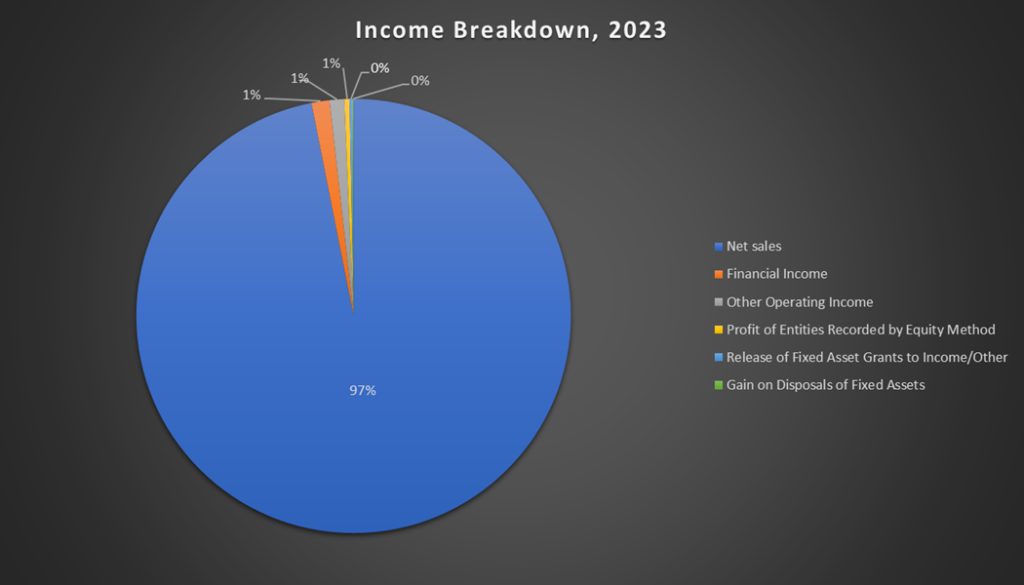
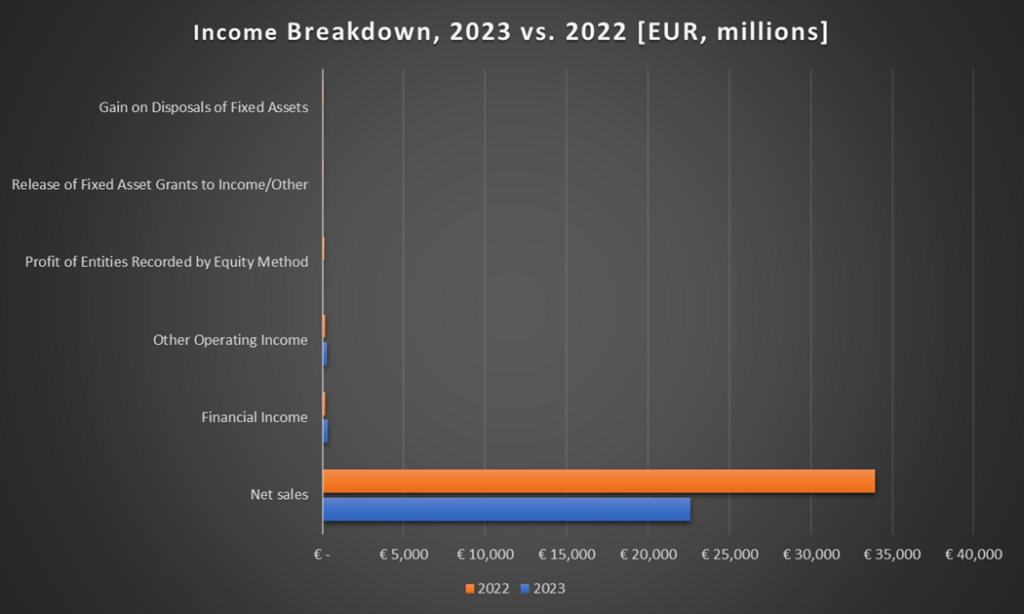
Per its Annual Financial Report for 2023, Naturgy earns money from the following income streams:
- Net Sales – includes sales of gas and access to distribution networks, sales of electricity and access to distribution networks. It also comprises LNG sales, registrations and facility checks, and assignment power generation capacity. Rentals meters and facilities and other related income are also included;
- Financial Income – covers investment dividends, interest income, and other related income;
- Other Operating Income – comprises other management income and concession construction or improvements services IFRIC;
- Profit of Entities Recorded by Equity Method – includes earnings from investment in companies (associates or joint ventures) accounted for using the equity method;
- Release of Fixed Asset Grants to Income/Other;
- Gain on Disposals of Fixed Assets.
Naturgy’s Income Highlight – Net Sales
Net sales accounted for most of Naturgy’s income in 2023. The company earned EUR 22.6 billion in net sales, a 33% drop compared to 2022. That equates to 97% of last year’s gross income, compared to 98% in 2022. So, what did Naturgy sell?
Naturgy’s net sales came from six streams, cutting across its two business segments (Energy Markets and Distribution Networks):
- Gas transport and distribution network access sales – i.e., regulator-approved remuneration for maintaining the gas distribution infrastructure and transporting the gas to customers;
- Gas sales in both the Last Resort Tariff or LRT (i.e., quarterly-fluctuating, regulator-set rates) and free (i.e., fixed/contracted, company-set rates) markets;
- Electricity transmission and distribution network access sales – i.e., regulator-approved remuneration for maintaining the electricity grid and transporting the electricity to customers);
- Electricity sales in both the Voluntary Small Consumer Price or PVPC (i.e., daily-fluctuating, regulator-set tariff) and free (i.e., fixed/contract company-set tariff) markets;
- Contracts for long-term renewable electricity sales;
- Other income, for example:
- Power generation capacity assignment contracts for its combined-cycle plants in Mexico (CFE) for a 25-year term;
- New subscriptions, which consist of the operation of coupling gas reception facilities to the distribution network and revenue from facility verifications;
- Rental of meters and facilities;
- Contracts for the provision of service.
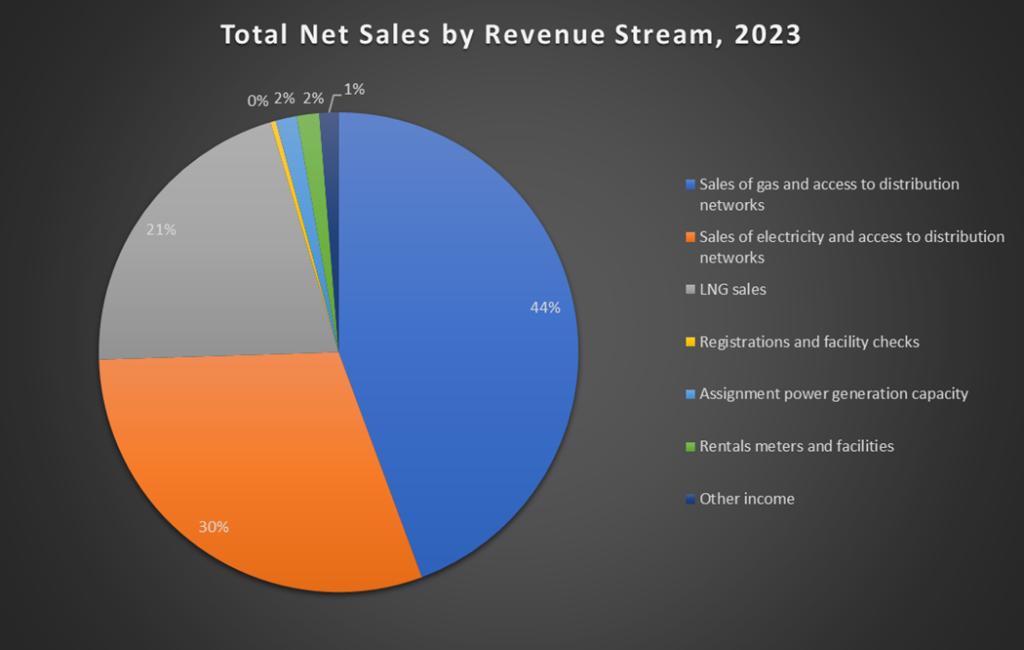
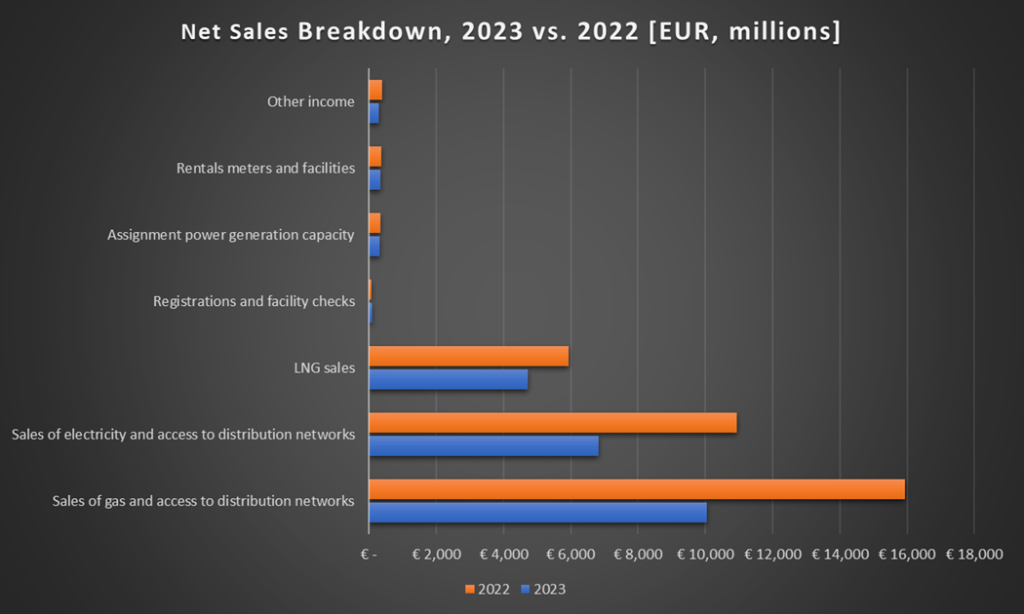
In 2023, the bulk of Naturgy’s net sales came from gas sales and remuneration for Gas Distribution Network Access, which brought in EUR 10 billion or 44% of net sales. Second place went to Electricity Sales and Remuneration for Electricity Distribution Network Access, with EUR 6.8 billion or 30% of net sales. Next was Liquefied Natural Gas (LNG) sales, which brought in EUR 4.7 billion or 21% of net sales.
These three net sales streams were also the largest in 2022. However, between 2022 and 2023, sales of gas and access to gas distribution networks, electricity and access to electricity distribution networks, and LNG fell by 37%, 38%, and 20%, respectively.
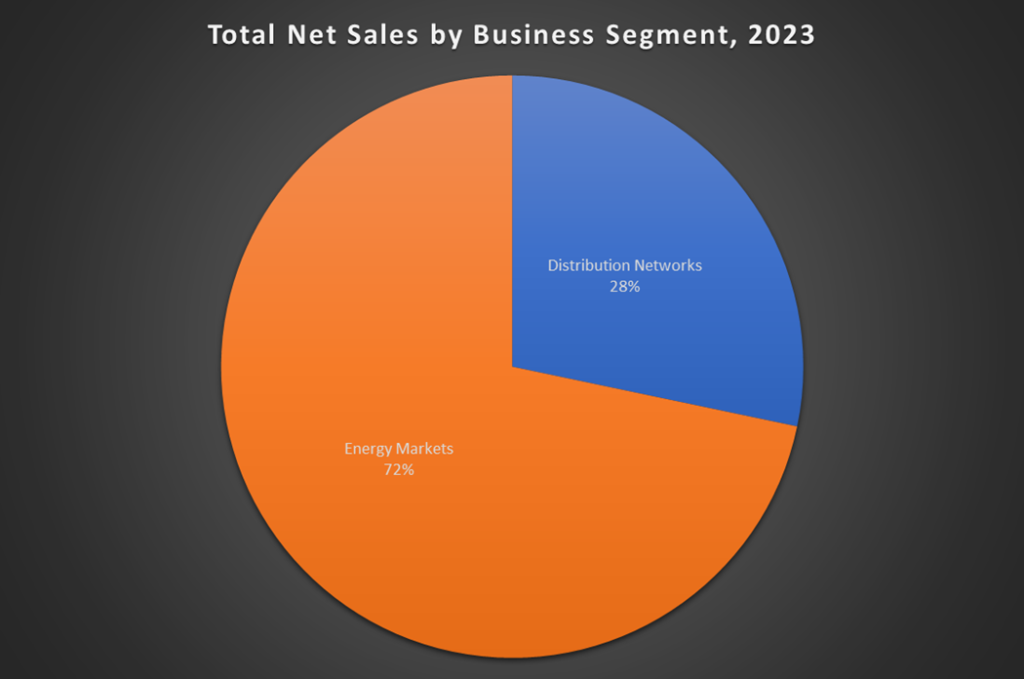
Within those 2023 net sales figures, the Energy Markets business segment brought in the lion’s share of 72%. On the other hand, the Distribution Networks business segment brought in 28% of net sales.
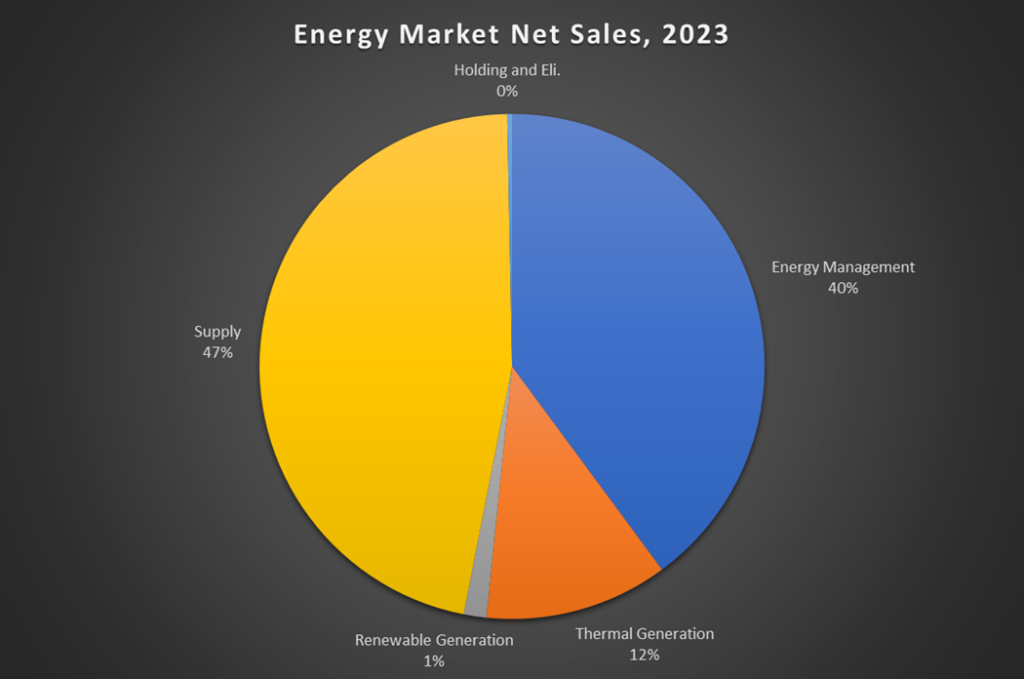
Most of the Energy Market business segment’s 72% pie came from Gas and Electricity Supply, at 47%. That was closely followed by Energy Management, at 40% of Energy Markets’ net sales. Meanwhile, thermal generation was third, at 12% of energy markets’ net sales.
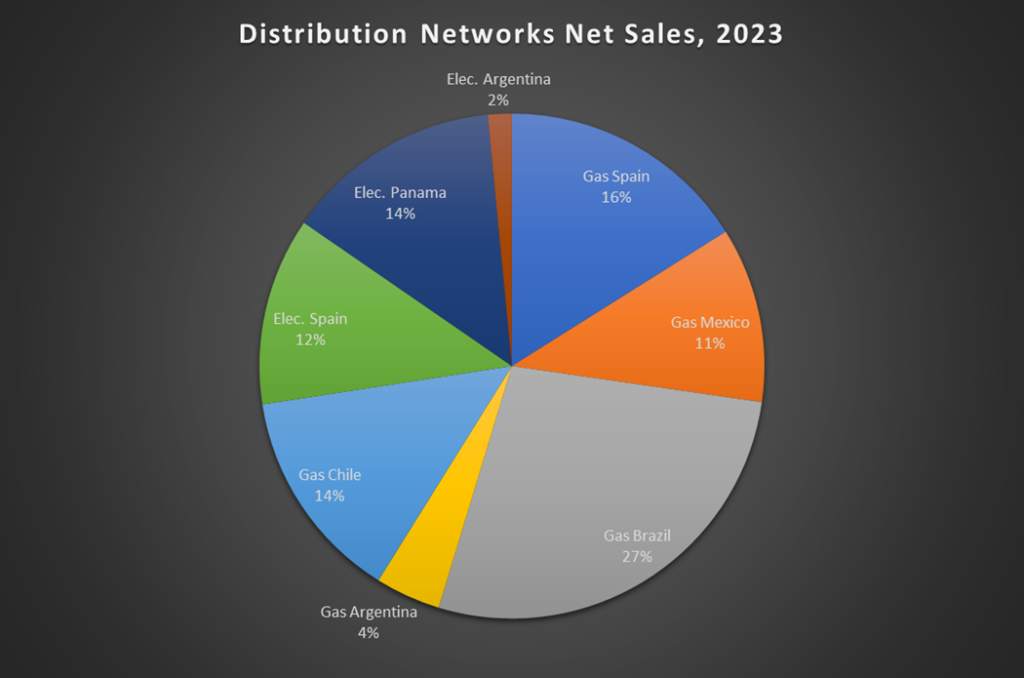
The bulk of the Distribution Networks’ 28% contribution came from Naturgy’s Brazil Gas infrastructure, at 27%. That was followed by its Spain Gas network, at 16%. Naturgy’s Chile Gas and Panama Electric infrastructure were each at 14%. Spain Electric and Mexico Gas networks were also notable, with 12% and 11% contributions to net sales from Naturgy’s Distribution Networks.
Looking at Naturgy’s net sales through a regional lens, Spain provided the majority of total net sales, bringing in EUR 11.6 billion in 2023, down from EUR 18 billion in 2022. So, Spain’s share of yearly net sales fell 35.5% in 2023 (i.e., from 53.0% to 51.4% of net sales).
Brazil, Mexico, and France followed Spain with 7.9% (EUR 1.78 billion), 6.3% (EUR 1.43 billion), and 6.2% (EUR 1.41 billion) of 2023 net sales. Between 2022 and 2023, France, Mexico, and Brazil saw their net sales contributions fall by 39.1%, 30.7%, and 13.1%, respectively.

Income Summary for Naturgy
Naturgy’s most important revenue streams are:
- Gas sales – 24% of net sales (mainly customer supply, 72%);
- Electricity sales – 23% of net sales (mainly customer supply, 62%);
- LNG sales – 21% of net sales;
- Gas distribution network access sales – 20% of net sales (mainly 38% Brazil, 21% Spain, 19% Chile, and 15% Mexico).
Most of Naturgy’s revenue comes from Spain (51%), Brazil (8%), Mexico (6%), France (6%), Chile (4%) and Panama (4%). The company’s revenue heavily depends on consumer demand for natural gas and electricity, especially in Spain. The Last Resort Tariff (TUR or LRT) for gas supply and the Voluntary Small Consumer Price (PVPC) for electricity supply set by regulators plays a crucial role in Naturgy’s income.
How Does Naturgy Spend Money?
The Big Expense Picture for Naturgy
Naturgy spends money on the following expense categories:
- Procurements – includes energy purchases, access to transmission networks, and other purchases and changes in inventories;
- Personnel expenses – covers wages and salaries, termination benefits, social security costs, defined contribution and benefit plans, share-based payments, and other related expenses;
- Other operating expenses – comprises taxes, operation and maintenance, advertising and other commercial services, professional services and insurance, concession construction or improvements services, supplies, services to customers, lean services, and other related costs;
- Depreciation, amortization and non-financial impairment losses – include amortization of intangible assets, depreciation of PPE (personal protective equipment), depreciation of right-of-use assets, intangible asset impairment, and PPE impairment;
- Financial expenses – covers the cost of borrowings, interest expenses, pension plans, and other related expenses (litigation, inflation adjustment due to hyperinflation in places like Argentina);
- Other results – translation differences relating to the liquidation of business units or interests, negative litigation or judgements;
- Loss on disposals of fixed assets;
- Impairment due to credit losses.
Naturgy’s Expense Highlight – Procurements
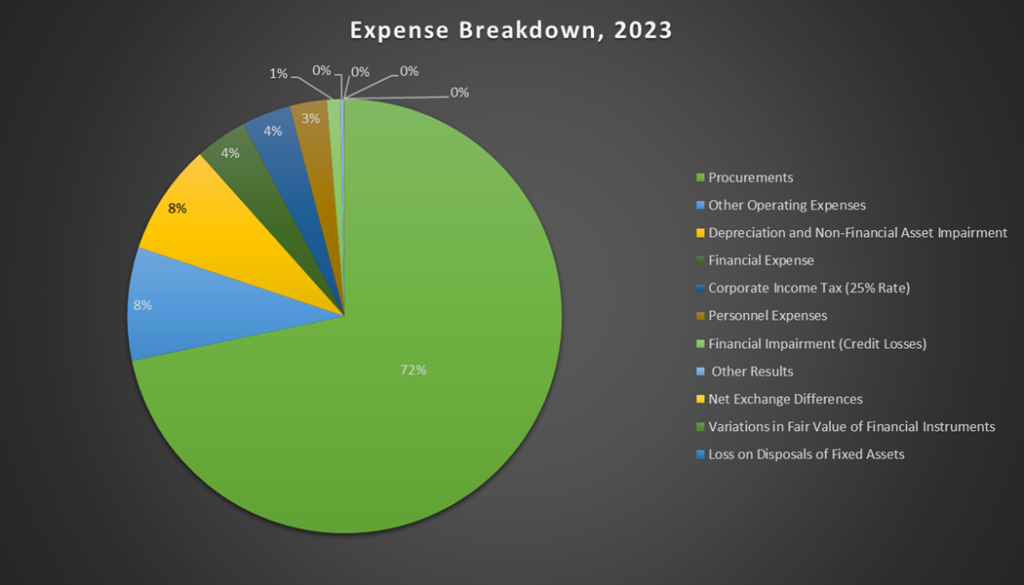
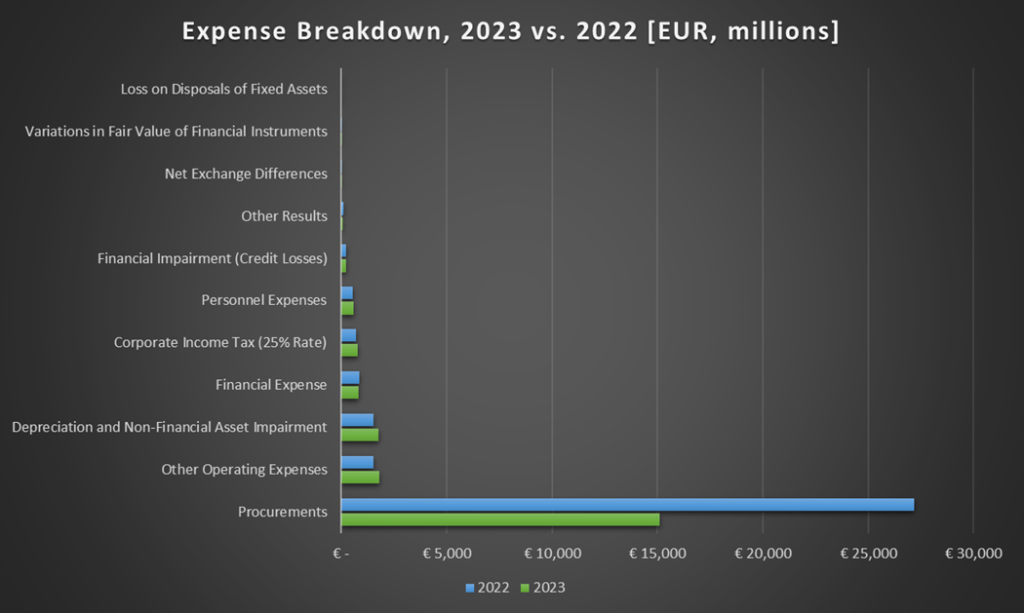
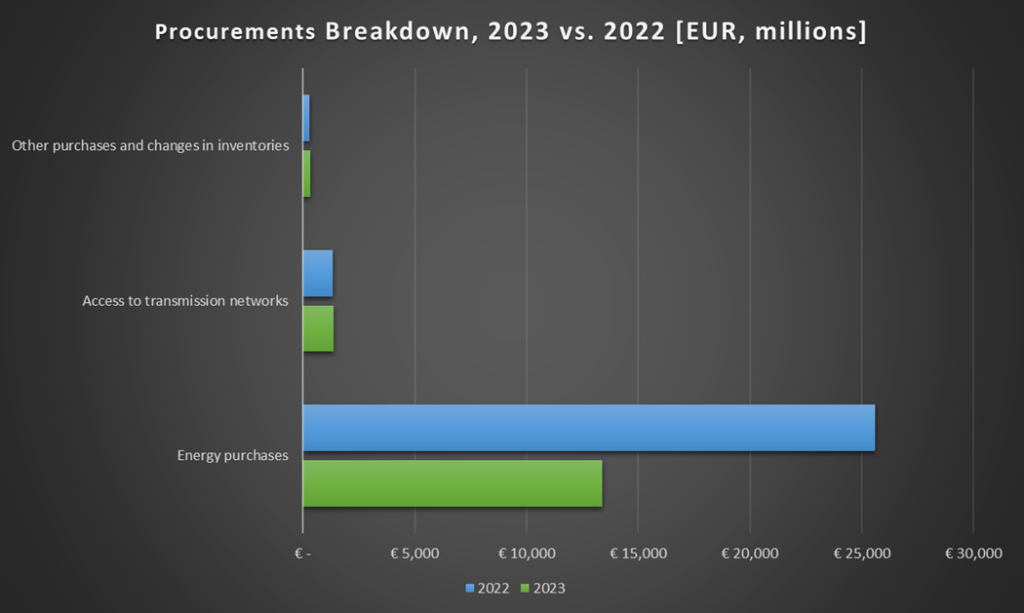
Procurements accounted for most of Naturgy’s expenses in 2023, as it did the year before. The company spent EUR 15.1 billion on procurements last year, a 44% drop compared to 2022. That equates to 72% of total expenses, compared to 83% in 2022. So, what was Naturgy buying?
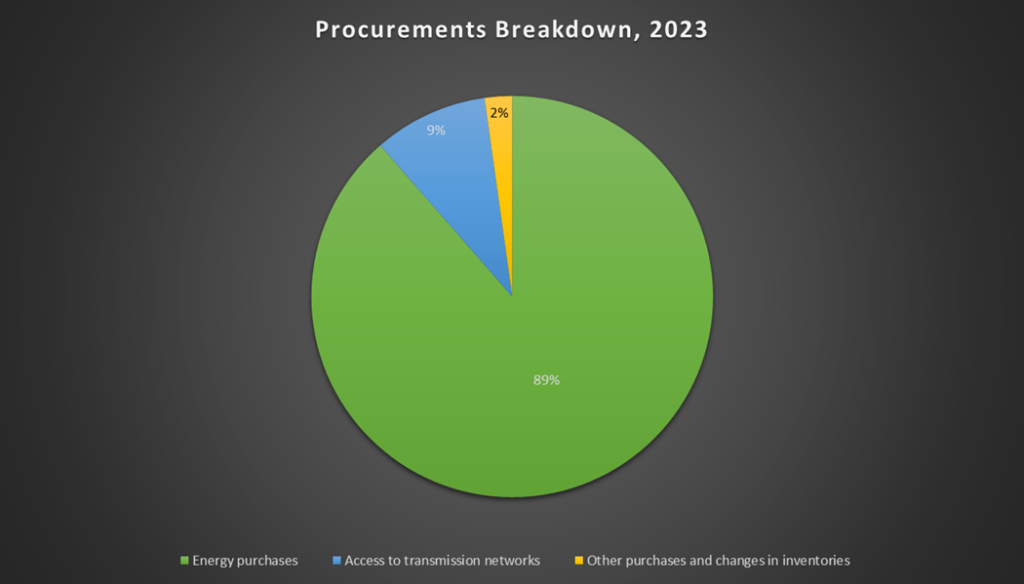
Energy purchases accounted for EUR 13.4 billion or 89% of procurements in 2023, compared to EUR 25.6 billion or 94% in 2022. That amounts to 64% of Naturgy’s total expenses last year, compared to 78% in 2022. The energy purchases in 2023 were 48% lower than in 2022, which implies a reduction in energy supplies to customers, a decrease in energy prices, or both.
Expenses Summary for Naturgy
By a wide margin, Naturgy’s most crucial expense item is energy purchases. This cost item accounted for 64% of the company’s gross expenses in 2023 (78% in 2022).
Who’s Trying To Eat Naturgy’s Lunch?
Naturgy’s competitors include:
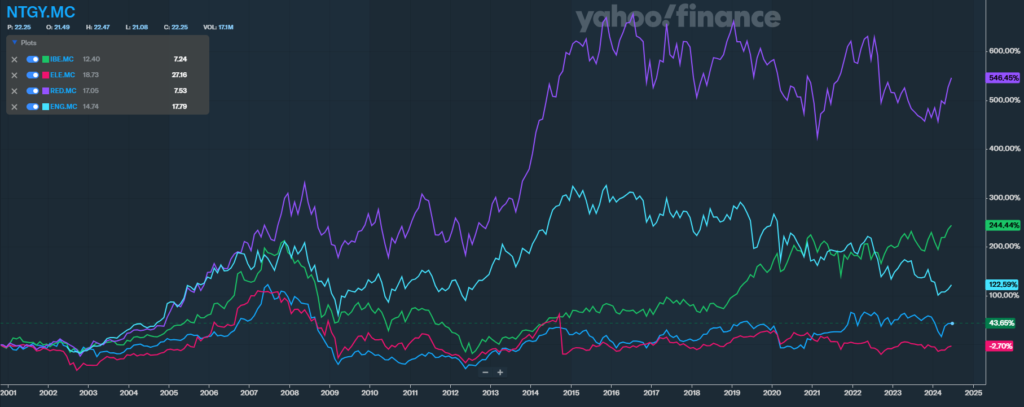
- Iberdrola, S.A. is one of the leading Spanish electricity producers and distributors. 51% of its net sales come from producing and selling electricity and renewable energy, and 49% comes from the transmission and distribution of electricity. Spain contributes 42% of its net sales, followed by the U.K. (18%), Brazil (15.9%), the United States (14.6%), and Mexico (7.5%). Iberdrola’s shares trade publicly on the Spanish stock exchange and have a market cap of EUR 76.82 billion (or 3.25 times Naturgy’s). The company has 41,384 employees (or 5.85 times Naturgy’s).
- Endesa, S.A. is one of Spain’s leading electricity producers and distributors. 76% of its net sales come from the generation and supply of energy. Spain contributes 82% of Endesa’s net sales, followed by France (5%), Portugal (4%), Luxembourg (3%), and Germany (2%). Endesa’s shares trade publicly on the Spanish stock exchange and have a market cap of EUR 19.04 billion (or 0.81 times Naturgy’s). The company has 9,035 employees (or 1.28 times Naturgy’s).
- Redeia Corporacion S.A. specializes in electricity transmission services and the operation of electric networks. Spain contributes 88.9% of its net sales, followed by Europe (1.6%) and others (9.5%). Redeia’s shares trade publicly on the Spanish stock exchange and have a market cap of EUR 8.88 billion (or 0.38 times Naturgy’s). The company has 2,445 employees (or 0.35 times Naturgy’s).
- Enagás, S.A. specializes in acquiring, transporting, regasifying and storing natural gas. Spain contributes 100% of net sales. Enagás’ shares trade publicly on the Spanish stock exchange and have a market cap of EUR 3.79 billion (or 0.16 times Naturgy’s). The company has 1,390 employees (or 0.20 times Naturgy’s).
Does Naturgy Have a Great Past and Present?
Beginning with a summary of Naturgy’s Q4 2023 earnings report, released on 27 February 2024:
- Yearly EBITDA increased by 11% to EUR 5.48 billion, exceeding the EUR 5.4 billion guidance.
- Quarterly EBITDA tumbled by 19% due to a very high comparison basis.
- Yearly net profit rose 20% to EUR 1.99 billion as lower financial costs (and negative one-offs in 2022) augmented EBITDA growth.
- Renewables was the main growth driver, with a 41% rise in its EBITDA contribution.
- Tariff increases across the main South American countries resulted in a 25% rise in South American networks’ EBITDA contribution.
- The negative accounting effect in 2022 offset lower gas prices and demand in 2023, increasing Energy Management’s EBITDA contribution by 11%.
- Supply’s EBITDA contribution rose 30% due to lower electricity procurement costs that offset the lower gas margin from residential customers transferring from the free market to regulated tariffs.
- Spanish electricity networks’ EBITDA contribution fell 5% due to higher costs.
Next, I looked at Naturgy’s valuation, profitability, liquidity, solvency, operational efficiency, dividend policy, and growth.
Valuation
Are Naturgy’s shares undervalued, fairly valued, or overvalued relative to its past and competitors? Since Naturgy is a profitable business, I assessed its price-to-earnings (P/E or PE) and price-to-cashflow (P/CF or PCF) ratios, as well as those of its peers, to answer these valuation questions.
One should note that PCF excludes noncash expenses like depreciation and amortization and relies on operating cashflow (ignoring cashflow from financing and investing). This exclusion makes PCF a more balanced valuation metric than PE as it removes any differences in businesses’ depreciation approach while focusing on cash from their primary operations.
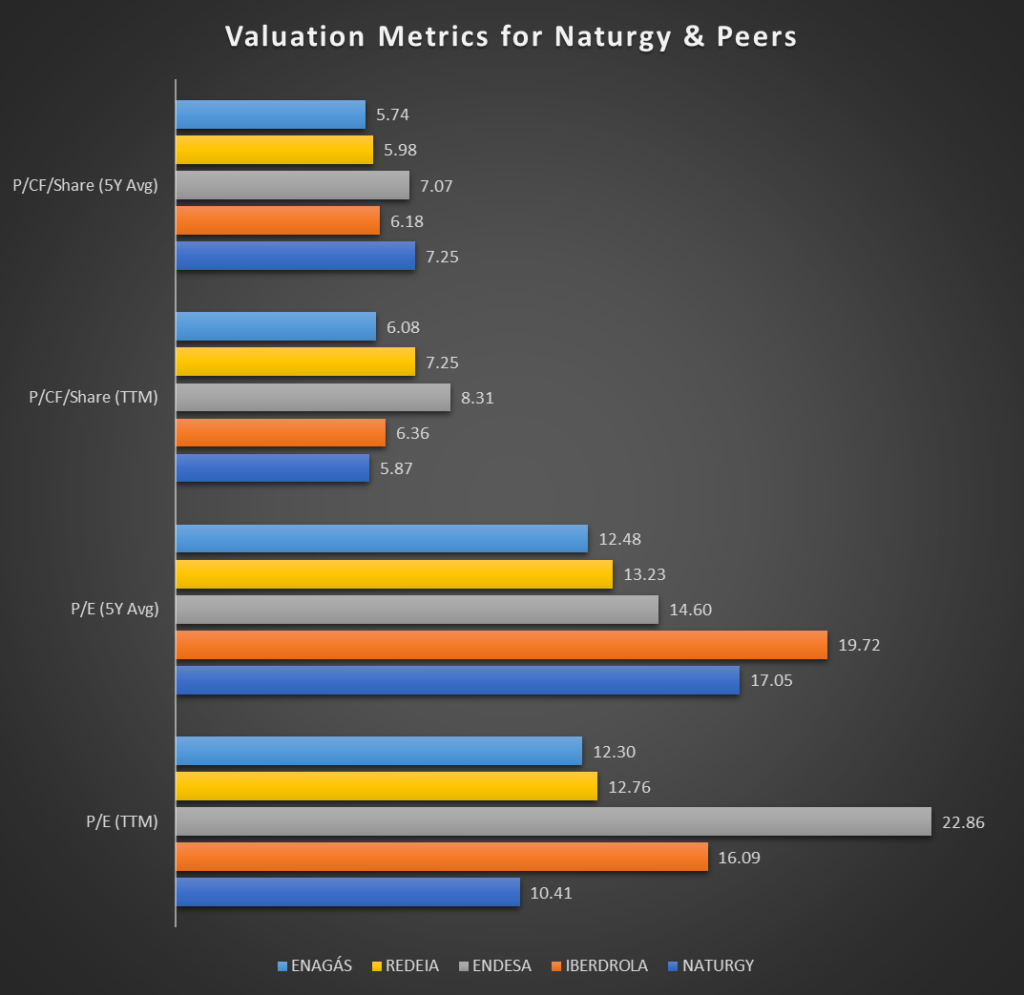
In the trailing twelve months (TTM), Naturgy had the lowest PE ratio (10.41) among its peers, which ranged between 12.30 (Enagas) and 22.86 (Endesa). However, in the past 5-years, it had the second-highest average PE ratio (17.05) in a peer range of 12.48 (Enagas) to 19.72 (Iberdrola).
The story is similar on a PCF ratio basis. In the TTM, Naturgy had the lowest PCF ratio (5.87) among its peers, which ranged between 6.08 (Enagas) and 8.31 (Endesa). However, in the past 5-years, it had the highest average PCF ratio (7.25), in a peer range of 5.74 (Enagas) to 7.07 (Endesa).
So, Naturgy is currently bucking its 5-year trend of overvaluation compared to its peers. If its valuation returns to the 5-year mean, it implies a significant share price rise or earnings and cash flow.
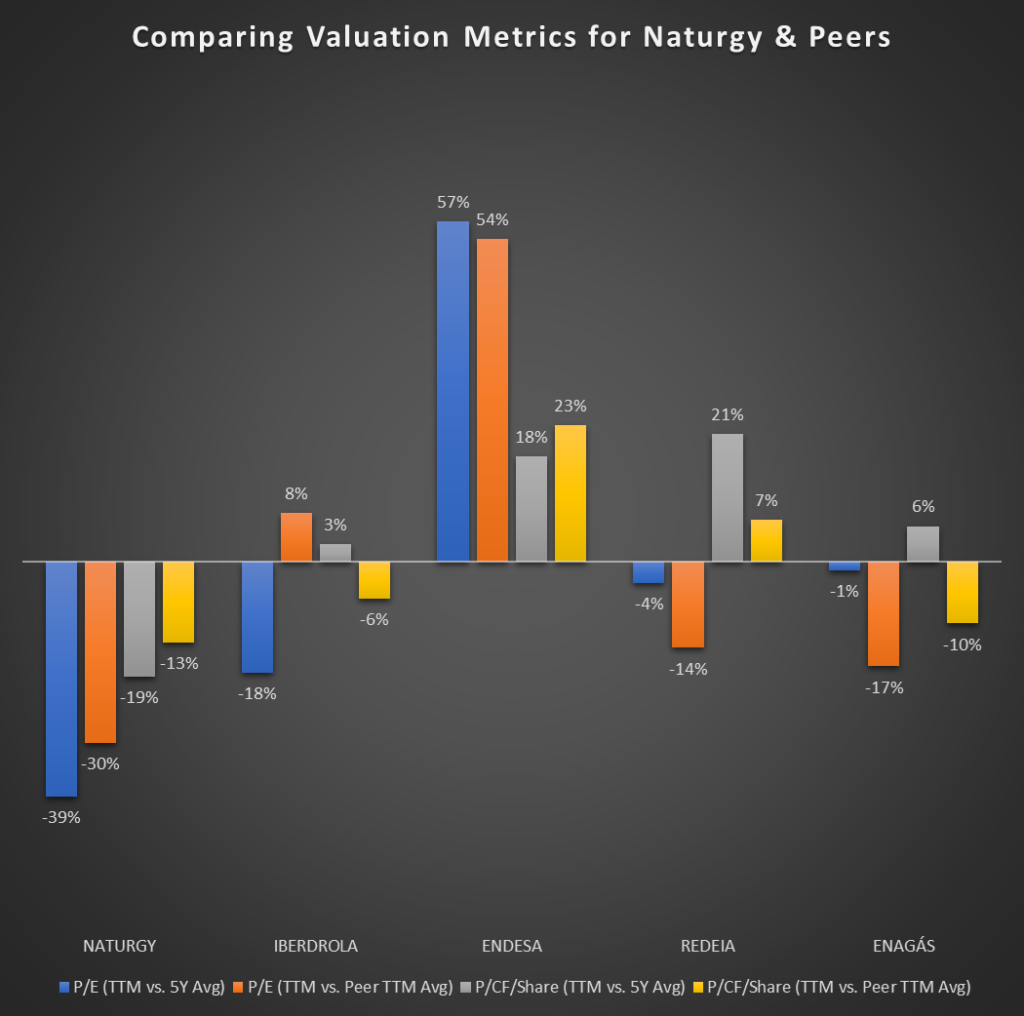
Comparing each company’s PE ratio in the trailing twelve months (TTM) to its 5-year average PE ratio, Naturgy is 39% undervalued, and the next best peer, Iberdrola, is 18% discounted. Also, Redeia and Enagas spot 4% and 1% undervaluation, respectively, but Endesa is 57% overvalued.
Moreover, assessing each business’ PE ratio (TTM) relative to the average peer PE ratio (TTM), Naturgy, Enagas, and Redeia are 30%, 17%, and 14% undervalued, respectively. However, Endesa and Iberdrola are 54% and 8% overvalued, respectively.
Evaluating each firm’s PCF ratio (TTM) relative to its 5-year average PCF, Naturgy is 19% undervalued. However, all its peers are overvalued – Iberdrola by 3%, Enagas by 6%, Endesa by 18%, and Redeia by 21%.
Moreover, comparing each company’s PCF ratio (TTM) to the average peer PCF ratio (TTM), Naturgy, Enagas, and Iberdrola are 13%, 10%, and 6% undervalued, respectively. However, Endesa and Redeia are 23% and 7% overvalued.
These PE and PCF ratio comparisons reiterate that Naturgy has been the most undervalued among its peers in the last twelve months. It also shows that the company’s current valuation is the lowest among its peers relative to their 5-year mean valuations. So, Naturgy wins the valuation race.
Profitability
How well does Naturgy produce income from its operations and assets? Does it have better profit margins (i.e., indicating a competitive advantage), returns on its resources, and earnings quality compared to its competitors?
I assessed profitability metrics like Return-on-Assets (ROA), Return-on-Equity (ROE), Return-on-Investment (ROI), gross and net profit margins, and earnings and revenue per share (EPS & RPS) for Naturgy and its peers to answer these questions.
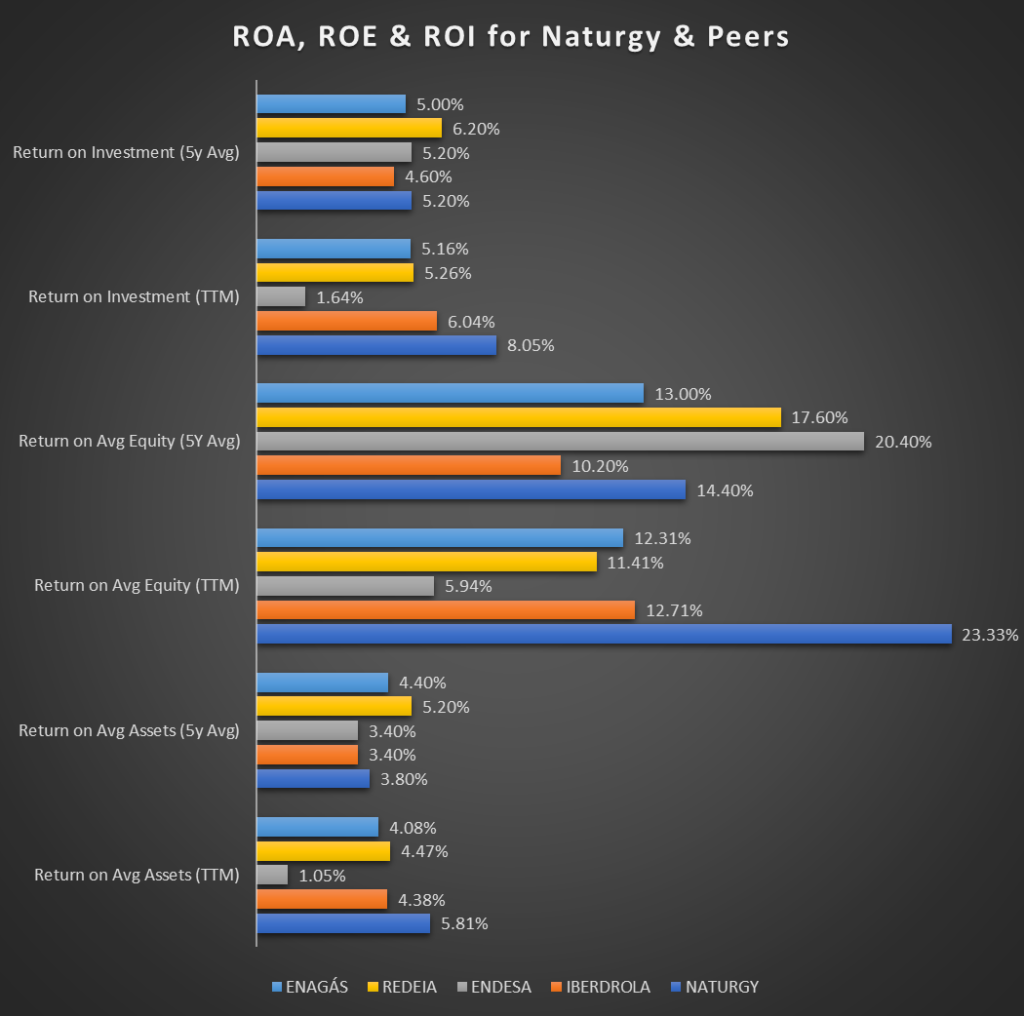
In the trailing twelve months (TTM), Naturgy had the highest ROA (5.81%) among its peers, which ranged between 1.05% (Endesa) and 4.47% (Redeia). However, in the past 5-years, Naturgy had the third-highest average ROA (3.80%) in a peer range of 3.40% (Iberdrola/Endesa) to 5.20% (Redeia).
Looking at ROE, in the TTM, Naturgy’s ROE (23.33%) was much higher than its peers, which ranged between 5.94% (Endesa) and 12.71% (Iberdrola). However, in the past 5-years, Naturgy has the third-highest average ROE (14.4%) in a peer range of 10.20% (Iberdrola) to 20.40% (Endesa).
Lastly, in the TTM, Naturgy had the highest ROI (8.05%) among its peers, which ranged between 1.64% (Endesa) and 6.04% (Iberdrola). Moreover, in the past 5-years, Naturgy had the second-highest average ROI (5.20%) in a peer range of 4.60% (Iberdrola) to 6.20% (Redeia).
So, on an ROA, ROE, and ROI basis, Naturgy has been more profitable than its peers in the last twelve months. Its recent returns are also higher than its 5-year mean. Moreover, although its 5-year average returns are not the highest among its peers, they are competitive.
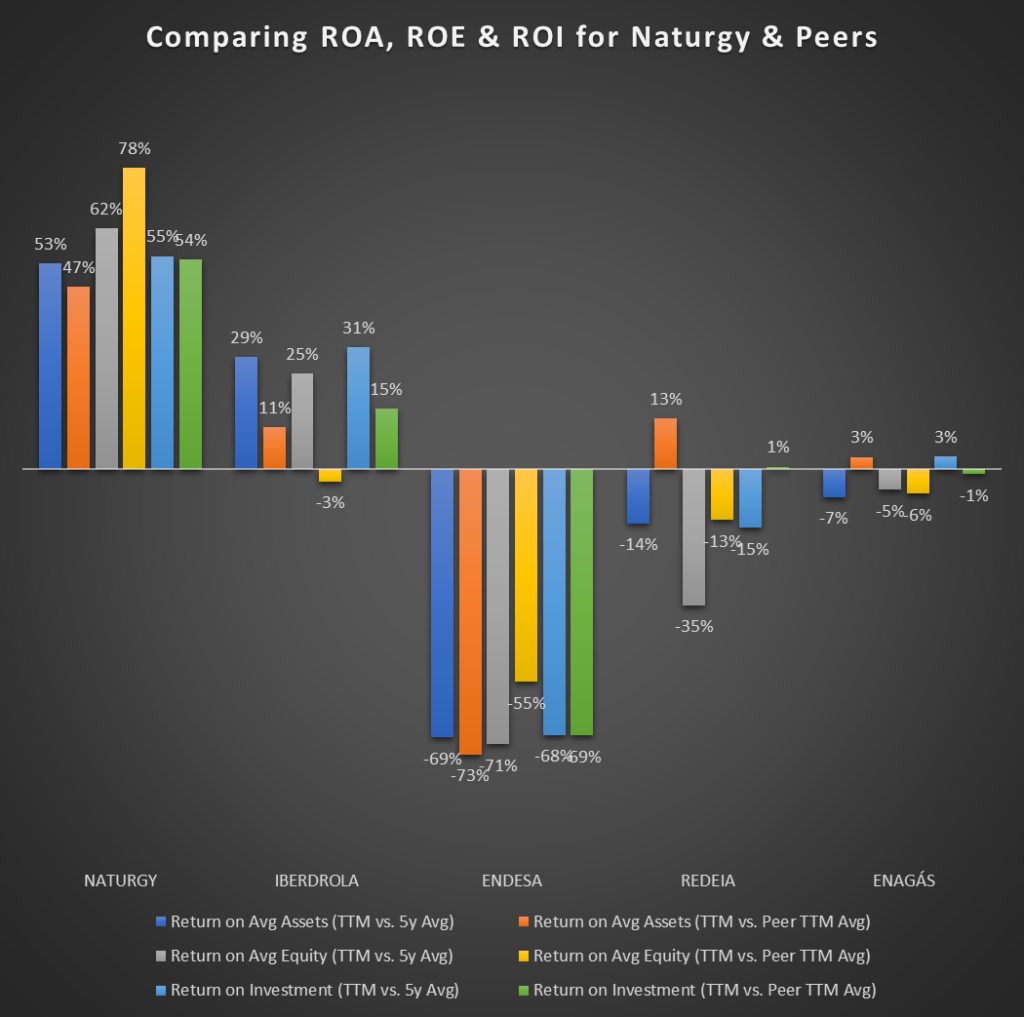
Comparing each company’s ROA in the trailing twelve months (TTM) to its 5-year average ROA, Naturgy’s current ROA is 53% higher. Also, its next-best peer, Iberdrola, improved by 29%. However, Enagas, Redeia, and Endesa’s ROAs are 7%, 14%, and 69% worse than their 5-year average.
Moreover, assessing each business’ ROA (TTM) relative to the average peer ROA (TTM), Naturgy tops the average by 47%. Also, Redeia, Iberdrola, and Enagas beat the average by 13%, 11%, and 3%, respectively. However, Endesa falls short of the average by 73%.
Evaluating each firm’s ROE (TTM) relative to its 5-year average ROE, Naturgy’s current ROE is 62% higher. Also, its next-best peer, Iberdrola, improved by 25%. However, Enagas, Redeia, and Endesa’s ROEs are 5%, 35%, and 71% worse than their 5-year average.
Moreover, comparing each company’s ROE (TTM) to the average peer ROE (TTM), Naturgy beats the average by 78% and is the only business to do so among its peers. Iberdrola, Enagas, Redeia, and Endesa have ROEs that are 3%, 6%, 13%, and 55% below the average.
Assessing each business’ ROI (TTM) relative to its 5-year average ROI, Naturgy’s current ROI is 55% higher. Also, Iberdrola and Enagas trail Naturgy with ROIs that are 31% and 3% improved. However, Redeia and Endesa’s ROIs are 15% and 68% worse than their 5-year average.
Moreover, evaluating each firm’s ROI (TTM) relative to the average peer ROI (TTM), Naturgy tops the average by 54%. Also, Iberdrola and Redeia beat the average by 15% and 1%, respectively. However, Endesa falls short of the average by 69%.
So, in the last twelve months, Naturgy generated 53% more returns from its assets than it did over the previous 5-years (on average) and 47% more than its peers generated in the same period. Also, the company returned 62% more from its shareholders’ equity in the last twelve months than it did over the previous 5-years (on average) and 78% more than its peers generated in the same period. Moreover, Naturgy generated 55% more returns from its invested capital than it did over the last 5-years (on average) and 54% more than its peers generated in the same period. Naturgy easily wins the ROA, ROE, and ROI race.
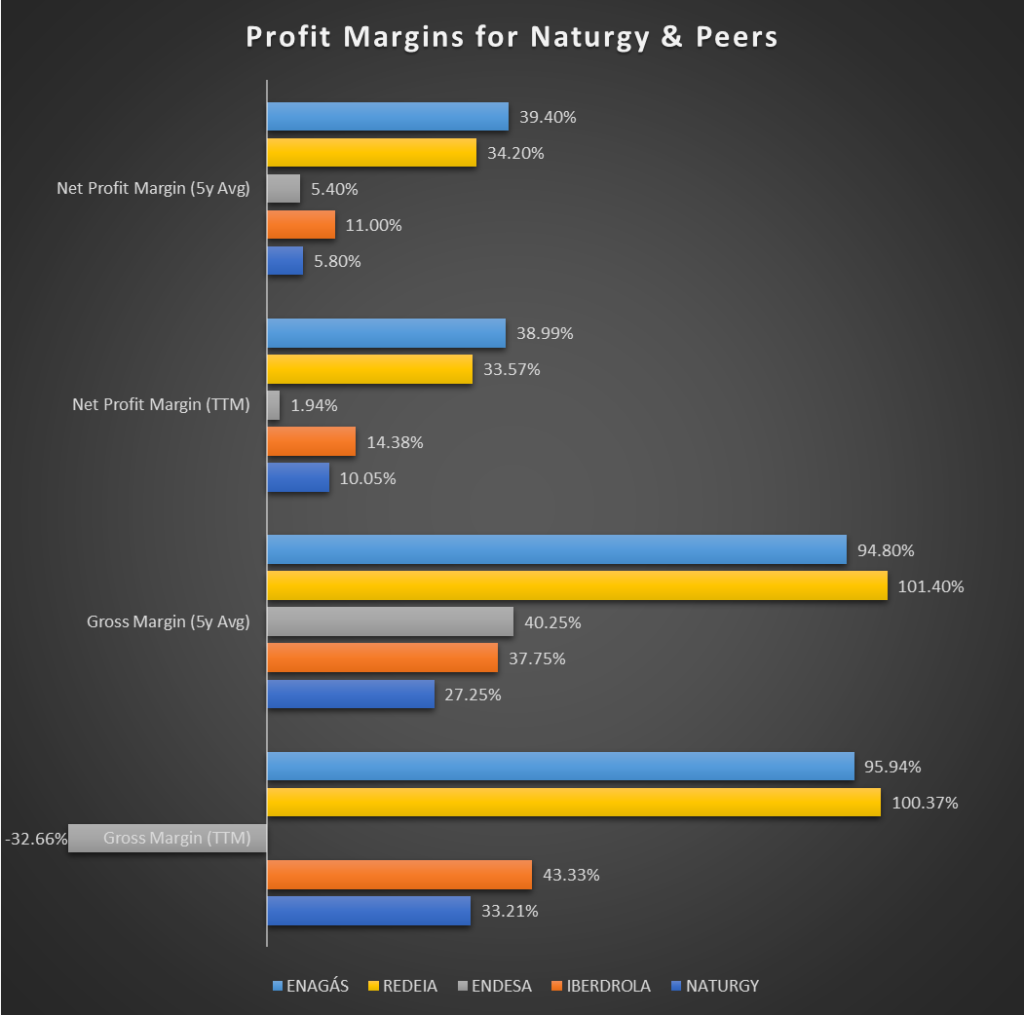
In the trailing twelve months (TTM), Naturgy had the second-lowest gross margin (33.21%) among its peers, which ranged between -32.66% (Endesa) and 100.37% (Redeia). Also, over the past 5-years, it had the lowest average gross margin (27.5%) in a peer range of 37.75% (Iberdrola) to 101.4% (Redeia).
The picture looks the same on a net profit margin basis. In the TTM, Naturgy had the second lowest net profit margin (10.05%) among its peers, which ranged between 1.94% (Endesa) and 38.99% (Enagas). Also, over the past 5-years, it had the second-lowest average net profit margin (5.8%) in a peer range of 5.40% (Endesa) to 39.40% (Enagas).
So, it’s not a stellar showing by Naturgy on gross and net profit margins. However, I am not entirely convinced by the data from some of its peers. How do Enagas and Redeia blow out on profit margins but underwhelm on ROA, ROE, and ROI, especially after maintaining such high margins over five years? Could this be a data integrity issue for these mid-cap stocks?
Naturgy’s gross and net profit margins of 33.21% and 10.05% in the last twelve months are impressive enough for any large-cap stock. That is especially so for a utility company. Moreover, those numbers are comparable to Iberdrola’s, another large-cap stock.
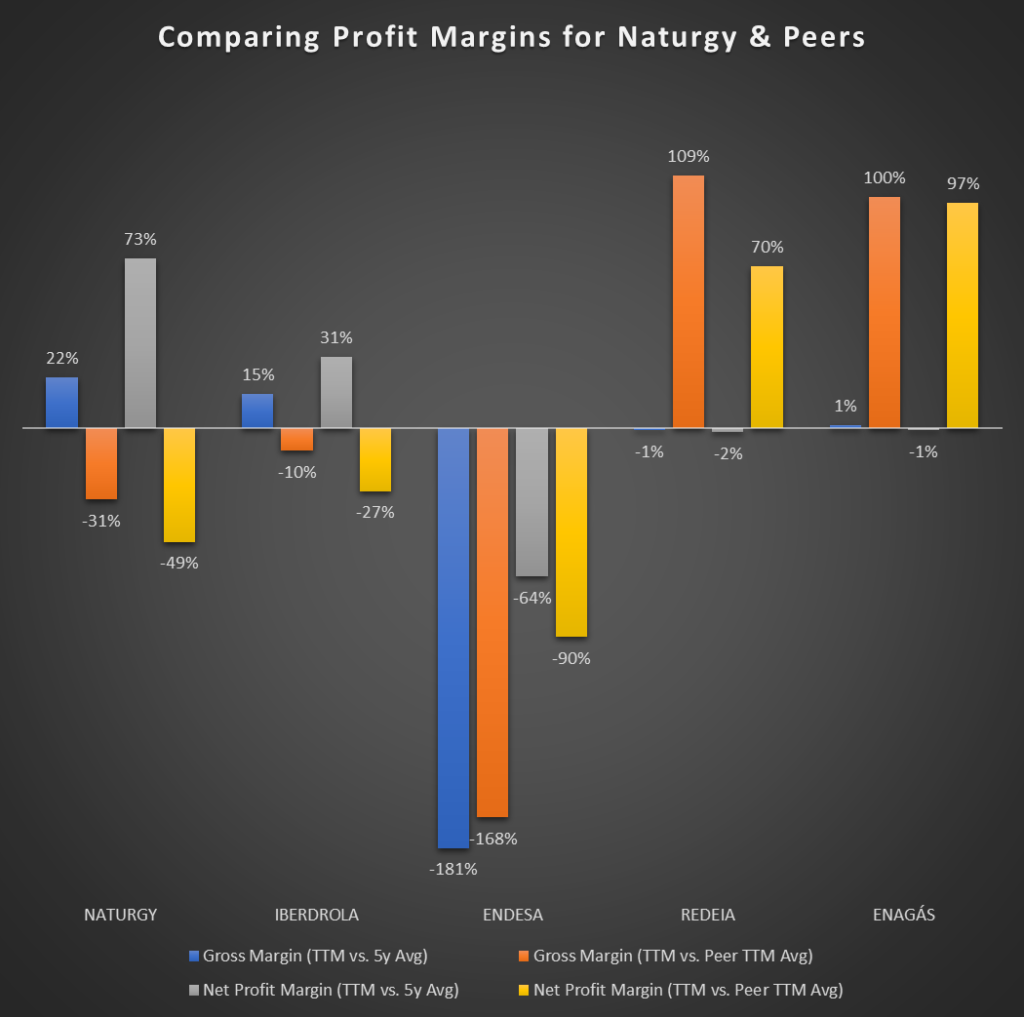
Comparing each company’s gross profit margin in the trailing twelve months (TTM) to its 5-year average gross profit margin, Naturgy’s current gross profit margin is 22% higher. Also, its next-best peers, Iberdrola and Enagas, have improved by 15% and 1%, respectively. However, Redeia and Endesa’s gross profit margins are 1% and 181% worse than their 5-year average.
Moreover, assessing each business’ gross profit margin (TTM) relative to the average peer gross profit margin (TTM), Redeia and Enagas beat the peer average by 109% and 100%, respectively. However, Endesa, Naturgy, and Iberdrola fall short of the average by 168%, 31%, and 10%, respectively.
Evaluating each firm’s net profit margin (TTM) relative to its 5-year average net profit margin, Naturgy’s current net profit margin is 73% higher. Also, its next-best peer, Iberdrola, is 31% improved. However, Enagas, Redeia, and Endesa’s net profit margins are 1%, 2%, and 64% worse than their 5-year average.
Furthermore, comparing each company’s net profit margin (TTM) to the average peer net profit margin (TTM), Enagas and Redeia beat the peer average by 97% and 70%, respectively. However, Endesa, Naturgy, and Iberdrola fall short of the average by 90%, 49%, and 27%, respectively.
So, in the last twelve months, Naturgy achieved 22% and 73% higher gross and net profit margins than it did over the previous 5-years (on average). However, due to eye-popping margins by Redeia and Enagas, Naturgy has 31% and 49% lower gross and net profit margins than its peers’ average.
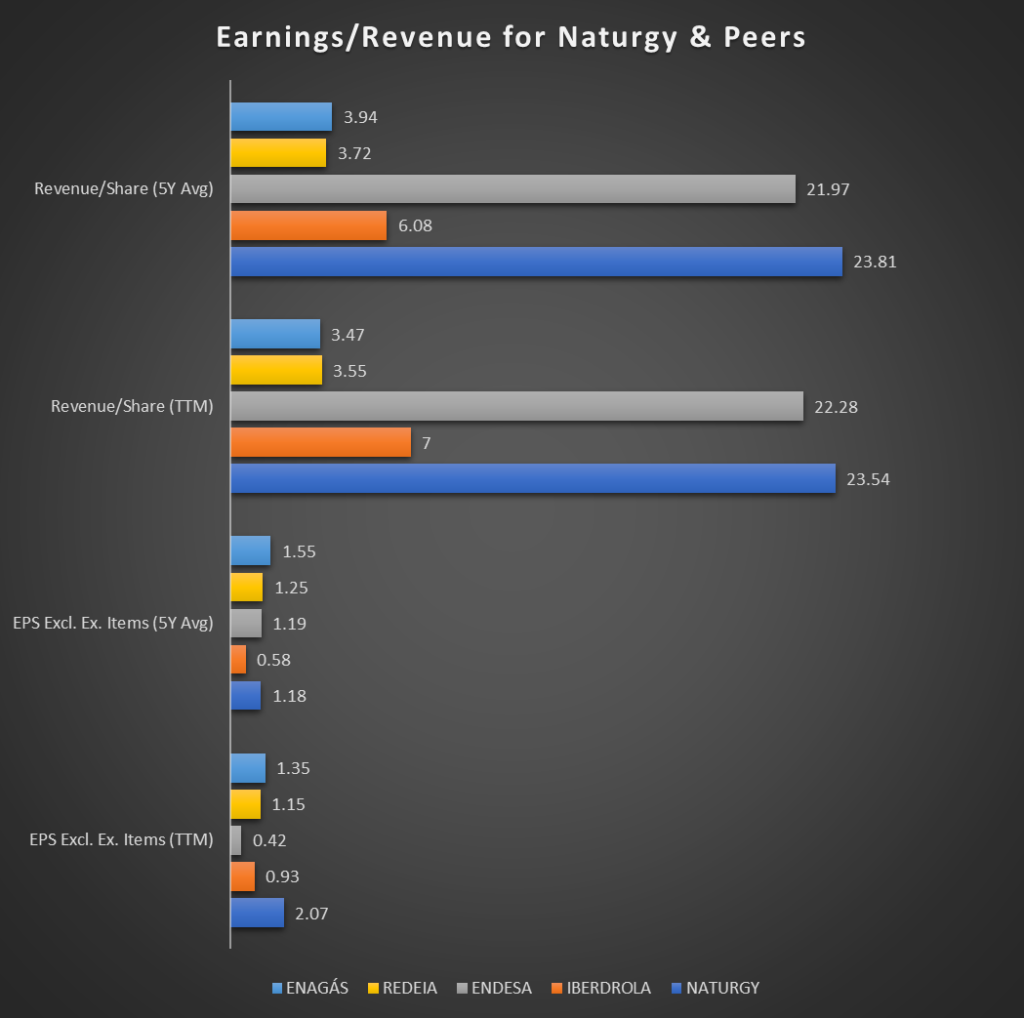
In the trailing twelve months (TTM), Naturgy had the highest earnings per share or EPS (2.07) among its peers, which ranged between 0.42 (Endesa) and 1.35 (Enagas). However, in the past 5-years, it had the fourth-highest average EPS (1.18), in a peer range of 0.58 (Iberdrola) to 1.55 (Enagas).
Looking at revenue per share or RPS (TTM), Naturgy had the highest RPS (23.54) among its peers, which ranged between 3.47 (Enagas) and 22.28 (Endesa). Moreover, in the past 5-years, it had the highest average RPS (23.81), in a peer range of 3.72 (Redeia) to 21.97 (Endesa).
So, in the last twelve months, Naturgy has been running away with the profitability race on earnings and revenue per share basis. While its average EPS over the past 5-years is not the highest among peers, it is competitive. Moreover, the company’s average RPS in the last 5-years dominates its peers.
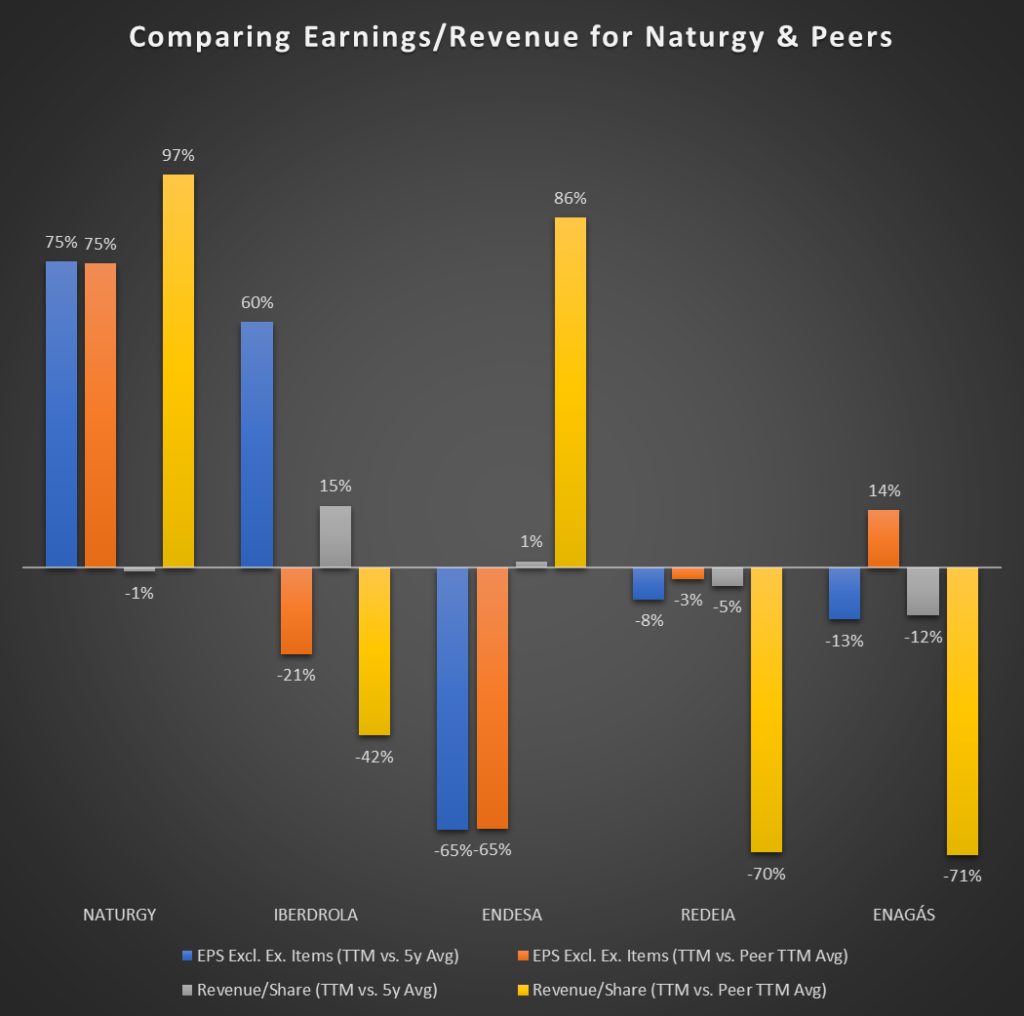
Comparing each company’s EPS in the trailing twelve months (TTM) to its 5-year average EPS, Naturgy’s current EPS is 75% higher. Also, its next-best peer, Iberdrola, improved by 60%. However, Redeia, Enagas, and Endesa’s EPS are 8%, 13%, and 65% worse than their 5-year average.
Moreover, assessing each business’ EPS (TTM) relative to the average peer EPS (TTM), Naturgy and Enagas beat the average by 75% and 14%, respectively. However, Redeia, Endesa, Iberdrola, and Endesa fall short of the average by 3%, 21%, and 65%, respectively.
Evaluating each firm’s RPS (TTM) relative to its 5-year average RPS, Naturgy’s current RPS is 1% lower. However, it is only bested by Iberdrola and Endesa’s 15% and 1% improved RPS, respectively. On the other hand, Enagas and Redeia’s RPS are 5% and 12% worse than their 5-year average, respectively.
Moreover, comparing each company’s RPS (TTM) to the average peer RPS (TTM), Naturgy and Endesa beat the peer average by 97% and 86%, respectively. However, Iberdrola, Redeia, and Enagas fall short of the peer average by 42%, 70%, and 71%, respectively.
So, in the last twelve months, Naturgy generated 75% higher EPS than it did over the previous 5-years (on average) and 75% higher EPS than its peers’ average in the same period. However, the company’s RPS in the last twelve months was flat compared to its 5-year average but 97% higher than its peer average.
Liquidity
How capable is Naturgy in paying its current liabilities using its current assets? To answer this question, I assessed the company’s and its peers’ current and quick ratios. As the quick ratio is more conservative than the current ratio, the optimal current ratio is 1.2 or greater, and a business with a quick ratio above 1.0 is considered sufficiently liquid.
Both ratios compare current liabilities to assets, so why is the quick ratio more stringent? The quick ratio excludes inventory from current assets (who knows what it is worth in a fire sale?). This means the quick ratio only considers a business’s most liquid assets (e.g., cash, marketable securities, and accounts receivable).
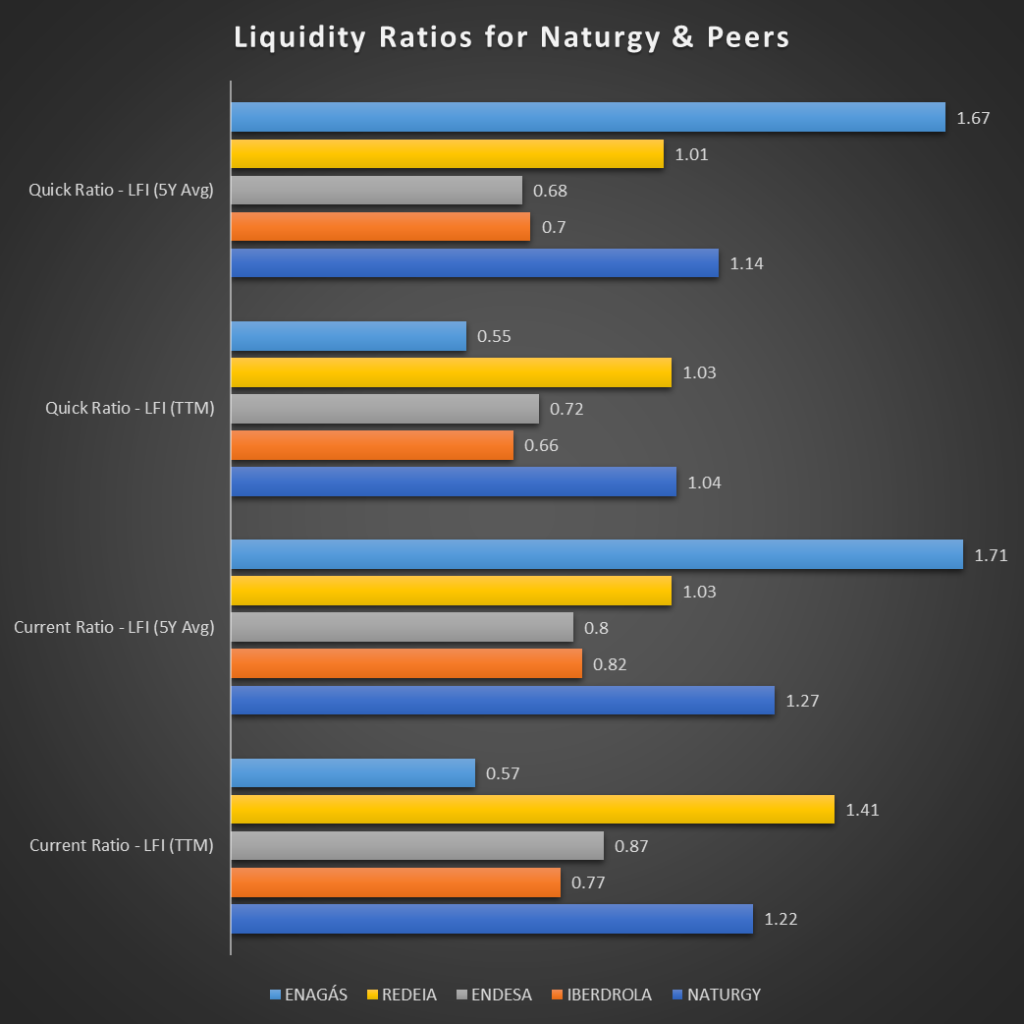
In the trailing twelve months (TTM), Naturgy had the second-highest current ratio (1.22) among its peers, which ranged between 0.57 (Enagas) and 1.41 (Redeia). Also, over the past 5-years, it has the second-highest average current ratio (1.27), in a peer range of 0.80 (Endesa) to 1.71 (Enagas). In both periods, Naturgy’s current ratio exceeded the 1.2 minimum threshold.
A similar story exists on a quick ratio basis. In the TTM, Naturgy had the highest quick ratio (1.04) among its peers, which ranged between 0.55 (Enagas) and 1.03 (Redeia). Also, over the past 5-years, it has the second-highest average quick ratio (1.14), in a peer range of 0.68 (Endesa) to 1.67 (Enagas). In both periods, Naturgy’s quick ratio exceeded the 1.0 minimum threshold.
So, Naturgy is either in first or very close second place in the current and quick ratio race. Moreover, its current and quick ratios are above the 1.2 and 1.0 optimal targets in the last twelve months and over the previous 5-years (on average). The company is sufficiently liquid and has a history of being so.
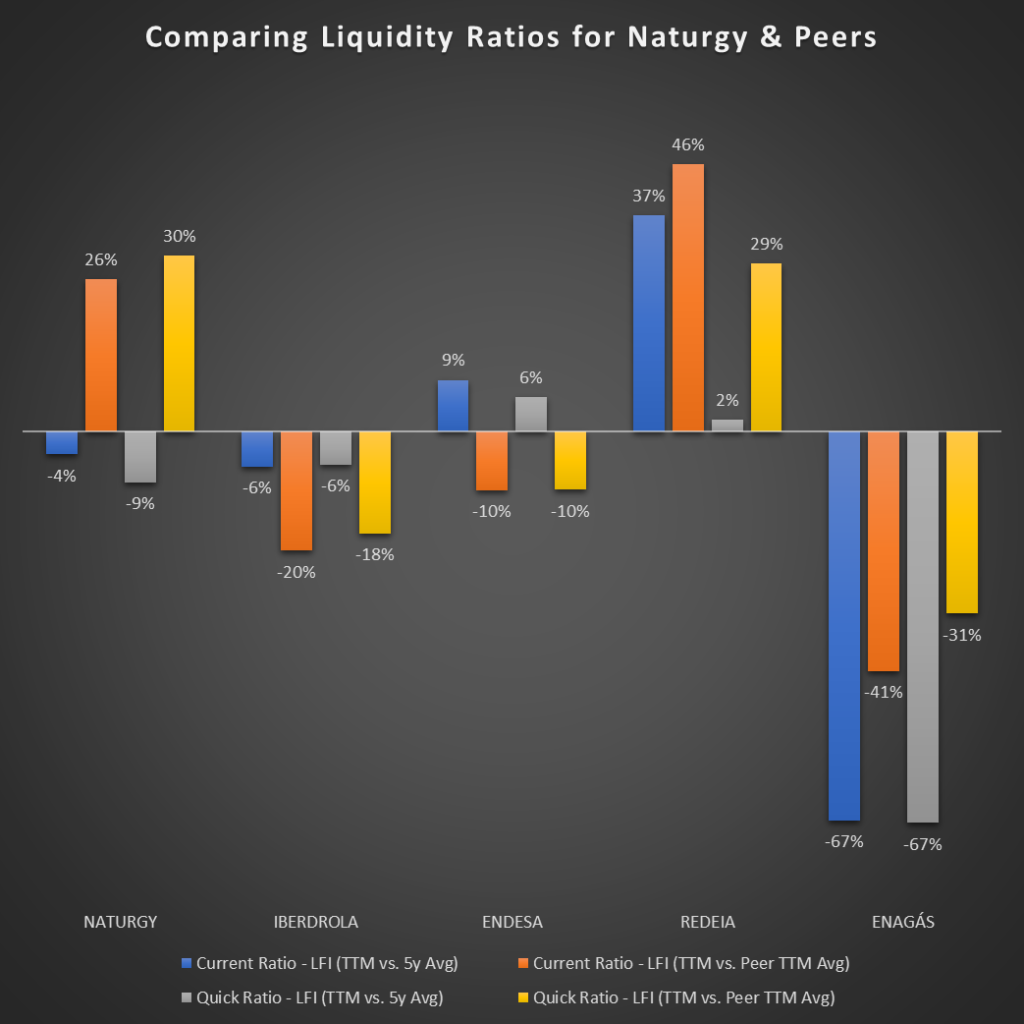
Comparing each company’s current ratio in the trailing twelve months (TTM) to its 5-year average current ratio, Naturgy’s current ratio is 4% lower. That lags Redeia’s 37% and Endesa’s 9% current ratio increase but beats Iberdrola’s 6% and Enagas’ 67% decrease.
Moreover, assessing each business’ current ratio (TTM) relative to the average peer current ratio (TTM), Naturgy’s current ratio is 26% higher, trailing Redeia’s 46%. On the other hand, Enagas, Iberdrola, and Endesa have current ratios of 41%, 20%, and 10% lower than the peer average, respectively.
Evaluating each company’s quick ratio in the trailing twelve months (TTM) relative to its 5-year average quick ratio, Naturgy’s quick ratio is 9% lower. That trails Endesa’s 6% and Redeia’s 2% increase. It also lags Iberdrola’s 6% decrease but beats Enagas’ 67% decline.
Moreover, comparing each business’s quick ratio (TTM) to the average peer quick ratio (TTM), Naturgy’s quick ratio is 30% higher, beating Redeia’s 29% increase. All its other peers’ quick ratios (TTM) lag the per-average – Enagas by 31%, Iberdrola by 18%, and Endesa by 10%.
So, Naturgy’s current and quick ratios in the last twelve months are slightly lower than they were over the past 5-years (on average). However, compared to its peers’ recent numbers, the company has the second-highest current ratio and the highest quick ratios. That reiterates the fact that the company has best-in-class liquidity.
Solvency
What is Naturgy’s debt burden? How capable is Naturgy of servicing its long-term debts and staving off default? To answer this question, I assessed the debt-to-equity (D/E or DE) ratio, debt-to-asset (D/A or DA) ratio, and interest coverage for Naturgy and its peers.
The DE and DA ratios compare the shareholder’s equity in a company and the business’s total assets to its debt burden. Interest coverage shows how many times over a business can pay its interest expenses using its earnings before interest and taxes (EBIT). So, lower debt-to-equity and debt-to-asset ratios, as well as higher interest coverage, are ideal. In general, interest coverage between 2 and 3 is preferred.
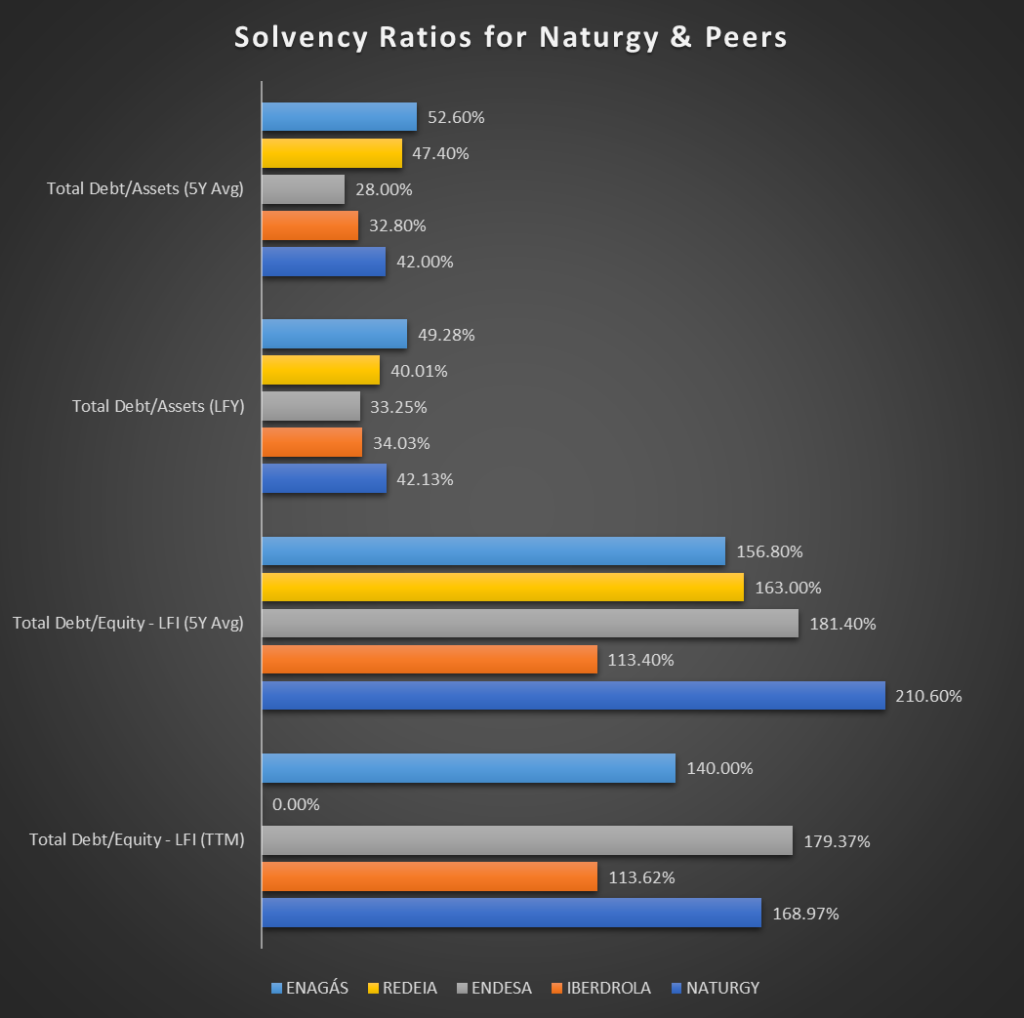
In the trailing twelve months (TTM), Naturgy had the second-highest debt-to-equity (DE) ratio (168.97%) among its peers, which ranged between 0% (Redeia) and 179.37% (Endesa). Moreover, in the past 5-years, Naturgy has the highest DE ratio (210.6%) on average, in a peer range of 113.4% (Iberdrola) to 181.4% (Endesa).
Also, in the TTM, Naturgy had the second-highest debt-to-asset (DA) ratio (42.13%) among its peers, which ranged between 33.25% (Endesa) and 49.28% (Enagas). Moreover, in the past 5-years, Naturgy has the third-highest DA ratio (42%) on average, in a peer range of 28% (Endesa) to 52.6% (Enagas).
So, Naturgy utilizes more debt than its shareholders’ equity and assets. However, this is not surprising for a utility company, as indicated by the high debt ratios of its peers.
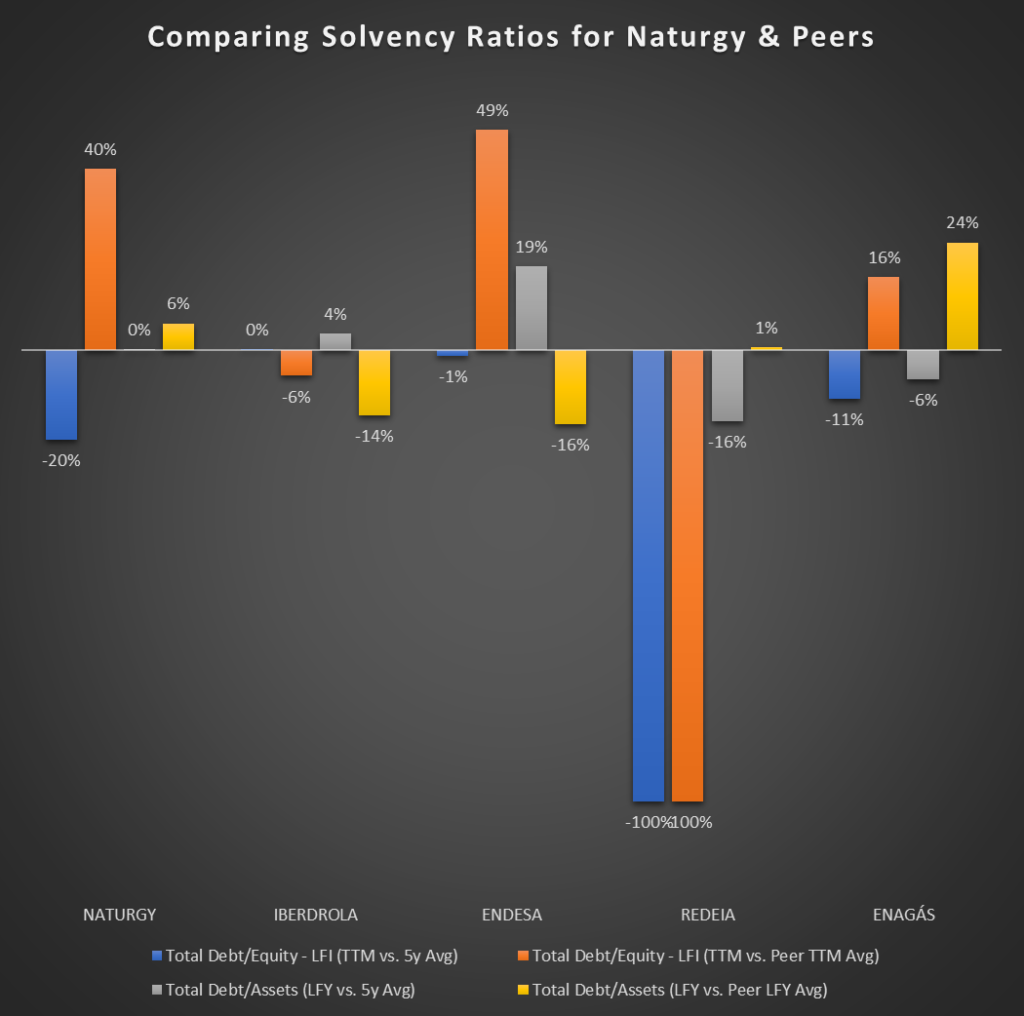
Comparing each company’s debt-to-equity (DE) ratio in the trailing twelve months (TTM) to its 5-year average DE ratio, Naturgy’s current DE ratio is 20% lower. That lags Redeia’s 100% decrease but beats Enagas’ 11% and Endesa’s 1% decline. Iberdrola’s DE ratio was flat.
Moreover, assessing each business’ DE ratio (TTM) relative to the average peer DE ratio (TTM), Naturgy’s DE ratio is 40% higher than the peer average. Endesa (by 49%) and Enagas (by 16%) also have DE ratios higher than the peer average. However, Redeia (by 100%) and Iberdrola (6%) have DE ratios lower than the peer average.
Evaluating each company’s debt-to-asset (DA) ratio in the last full year (LFY) relative to its 5-year average DA ratio, Naturgy’s DA ratio is unchanged. That lags Redeia’s 16% and Enagas’ 6% decrease but beats Endesa’s 19% and Iberdrola’s 4% increase.
Moreover, comparing each business’ DA ratio (LFY) to the average peer DA ratio (LFY), Naturgy’s DA ratio is 6% higher than the peer average. That is only lower than Enagas, whose DA ratio is 24% higher than the peer average. Endesa and Iberdrola’s DA ratios are 16% and 14% lower than the peer average, while Redeia’s DA ratio is 1% higher than the peer average.
So, Naturgy has neither the worst nor the best debt-to-equity and debt-to-asset ratios. But, like most utility firms, the company and its peers have high debt burdens. So, the interest coverage ratio may be the vital solvency metric for investors in these companies.
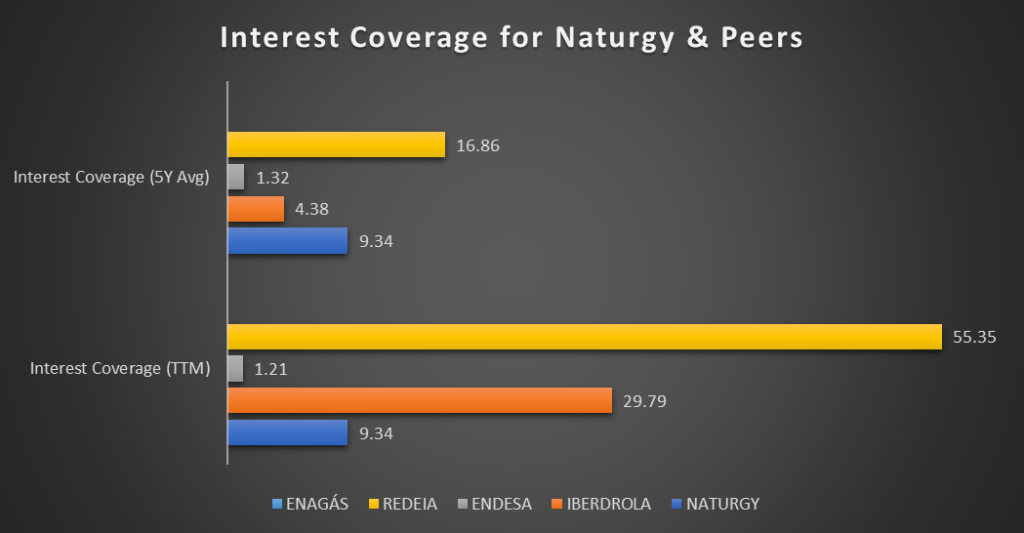
In the trailing twelve months (TTM), Naturgy had the third-highest interest coverage ratio (ICR), 9.34, among its peers, which ranged between 1.21 (Endesa) and 55.35 (Redeia). Also, over the past 5-years, it had the second-highest ICR (9.34) on average, in a peer range of 1.32 (Endesa) to 16.86 (Redeia).
So, Naturgy can pay the interest on its debt nine times over, using its earnings before interest and tax (EBIT). That is thrice the optimal interest coverage of 2-3, meaning the company is comfortable with its debt levels.
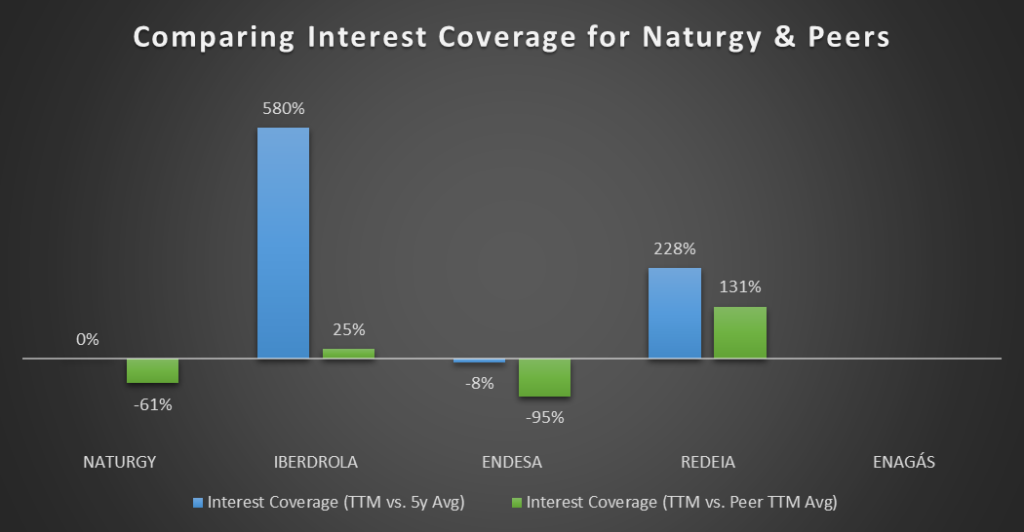
Comparing each company’s interest coverage ratio (ICR) in the trailing twelve months (TTM) to its 5-year average ICR, Naturgy’s current ICR is unchanged. On the other hand, Iberdrola and Redeia improved their ICR by 580% and 228%, respectively, while Endesa’s ICR fell by 8%.
Moreover, assessing each business’ ICR (TTM) relative to the average peer ICR (TTM), Naturgy and Endesa’s ICRs are 61% and 95% lower than the peer average. However, Redeia and Iberdrola’s ICRs beat the peer average by 131% and 25%, respectively.
These summaries exclude Enagas, as I could not find this data.
So, Naturgy’s ICR is neither the best nor the worst among its peers in the last twelve months and over the past 5-years (on average). However, its ICR (9.34) exceeds the generally accepted range of 2-3 by 300%. I prefer the company to improve this metric relative to its peers. Still, I am comfortable with where it is today.
Efficiency
How well is Naturgy managing its resources and operations? Is it optimally utilizing its assets and inventory to generate revenue? Does it have trouble cashing its customers’ bills? I assessed the company’s and its competitors’ asset turnover, inventory, and receivables turnover ratios to answer these operational efficiency questions.
The higher the asset and inventory turnover ratios, the more efficiently a business turns its assets and inventory into revenue. On the other hand, the lower the receivables turnover ratio, the sooner a company is getting paid by its customers (i.e., no blocked credit or funny business in its income reports).
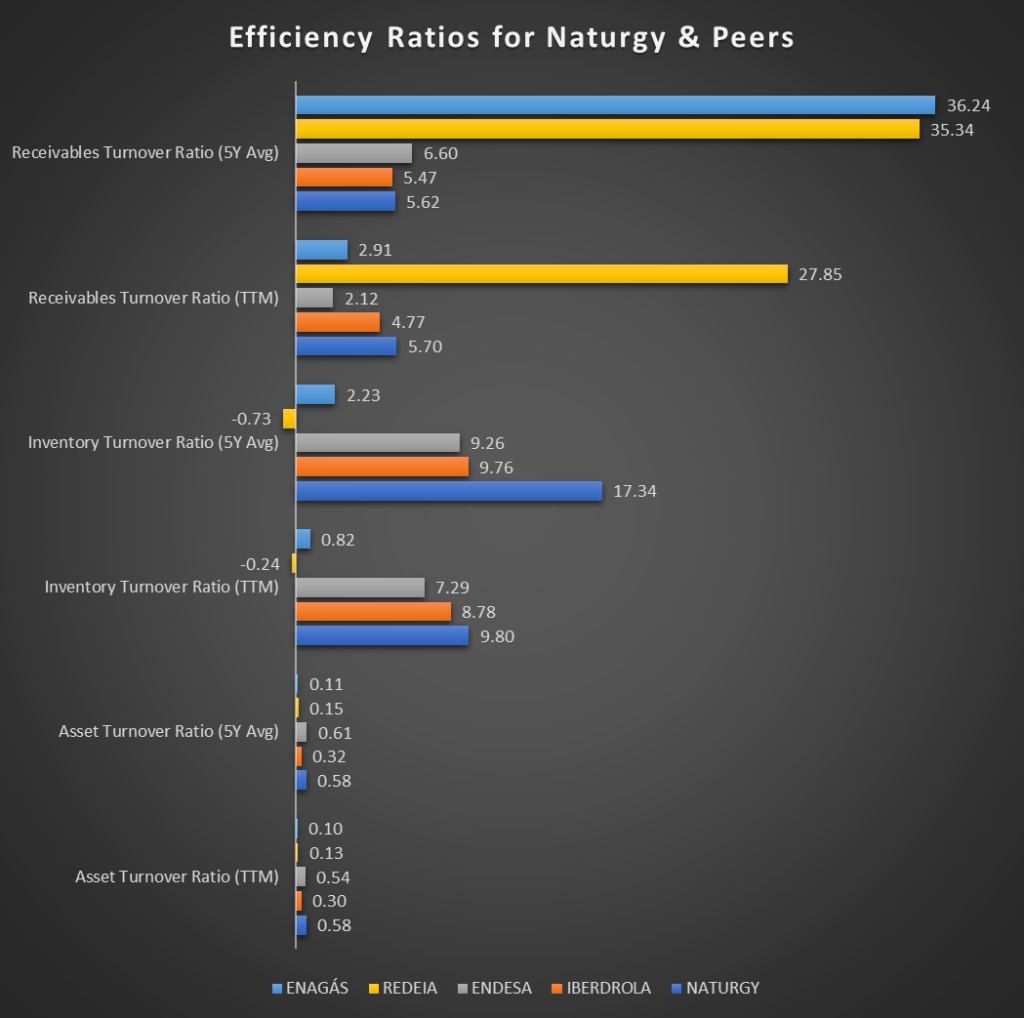
In the trailing twelve months (TTM), Naturgy had the highest asset turnover ratio (0.58) among its peers, which ranged between 0.10 (Enagas) and 0.54 (Endesa). Also, over the past 5-years, it had the second highest asset turnover ratio (0.58), in a peer range of 0.11 (Enagas) to 0.61 (Endesa).
The story is similar on an inventory turnover ratio basis. In the TTM, Naturgy had the highest inventory turnover ratio (9.80) among its peers, which ranged between -0.24 (Redeia) and 8.78 (Iberdrola). Also, over the past 5-years, it had the highest inventory turnover ratio (17.34), in a peer range of -0.73 (Redeia) to 9.76 (Iberdrola).
Lastly, in the trailing twelve months (TTM), Naturgy had the second-highest receivable turnover ratio (5.70) among its peers, which ranged between 2.12 (Endesa) and 27.85 (Redeia, an outlier). Moreover, in the past 5-years, it had the second-lowest receivable turnover ratio (5.62), in a peer range of 5.47 (Iberdrola) to 36.24 (Enagas, an outlier along with Endesa’s 35.34).
So, Naturgy has dominated asset and inventory turnover over the last twelve months and the past 5-years. Although its receivables turnover is not the lowest among its peers, it has maintained a stable and reasonable turnover in the last twelve months and over the previous 5-years.
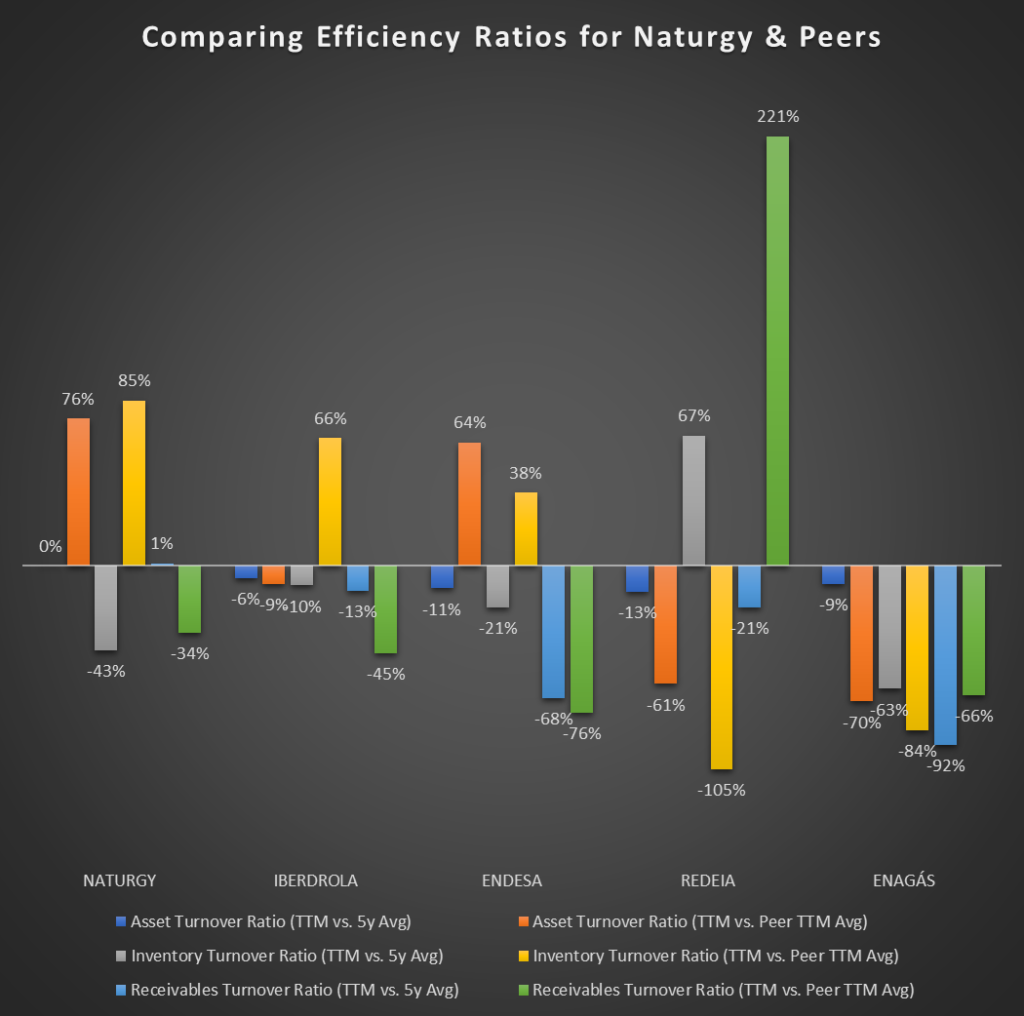
Comparing each company’s asset turnover ratio in the trailing twelve months (TTM) to its 5-year average asset turnover ratio, Naturgy’s is unchanged. However, all its peers’ asset turnover ratios fell – Iberdrola by 6%, Enagas by 9%, Endesa by 11%, and Redeia by 13%.
Moreover, assessing each business’ asset turnover ratio (TTM) relative to the average peer asset turnover ratio (TTM), Naturgy is 76% above the peer average, followed by Endesa at 64%. However, Iberdrola (by 9%), Redeia (by 61%), and Enagas (by 70%) are below the peer average.
Evaluating each firm’s inventory turnover ratio (TTM) relative to its 5-year average inventory turnover ratio, Naturgy’s fell by 43%. So did Iberdrola (by 10%), Endesa (by 21%), and Enagas (by 63%). However, Redeia’s inventory turnover ratio rose by 67%.
Moreover, comparing each company’s inventory turnover ratio (TTM) to the average peer inventory turnover ratio (TTM), Naturgy is 85% above the peer average. Iberdrola (by 66%) and Endesa (by 38%) are also above the peer average. However, Enagas (by 84%) and Redeia (by 105%) are below the peer average.
Assessing each company’s receivable turnover ratio (TTM) relative to its 5-year average receivable turnover ratio, Naturgy’s rose by 1%. However, all its peers’ receivable turnover ratios fell – Iberdrola by 13%, Redeia by 21%, Endesa by 68%, and Enagas by 92%.
Moreover, comparing each business’s receivable turnover ratio (TTM) to the average peer receivable turnover ratio (TTM), Naturgy is 34% below the peer average. Iberdrola (by 45%), Enagas (by 66%), and Endesa (by 76%) are also below the peer average. However, Redeia’s receivable turnover ratio is 221% above the peer average.
So, Naturgy’s efficiency in turning assets into revenue has been unchanged in the last 5-years. At the same time, all its peers’ ability to do the same worsened by an average of 9.8%. Also, the company still receives payment from customers with the same efficiency it had over the last 5-years, although all its peers improved by an average of 48.5%. Moreover, Naturgy is almost half as efficient in converting its inventory into revenue as it has been over the past 5-years (on average); however, all but one of its peers also worsened by an average of 31.3%. Lastly, in the last twelve months, Naturgy’s asset and inventory turnovers are the best among peers, while its receiveable turnover is below the peer average.
Dividends
What proportion of earnings does Naturgy pay to shareholders as dividends? How much does Naturgy pay out in dividends yearly relative to its share price? Does Naturgy’s dividend policy favourably compare to its peers? To answer these questions, I assess the dividend payout ratio (DPR) and dividend yield of Naturgy and its peers. Although I am not a dividend investor, if a company pays dividends, its dividend policy can shed more light on its financial situation and prospects.
Dividend investors consider a dividend payout ratio between 35% and 55% healthy and appropriate. Moreover, dividend payout ratios are also grouped as high (55% to 75%), very high (75% to 95%), unsustainable (95% to 150%), and very unsustainable (over 150%).
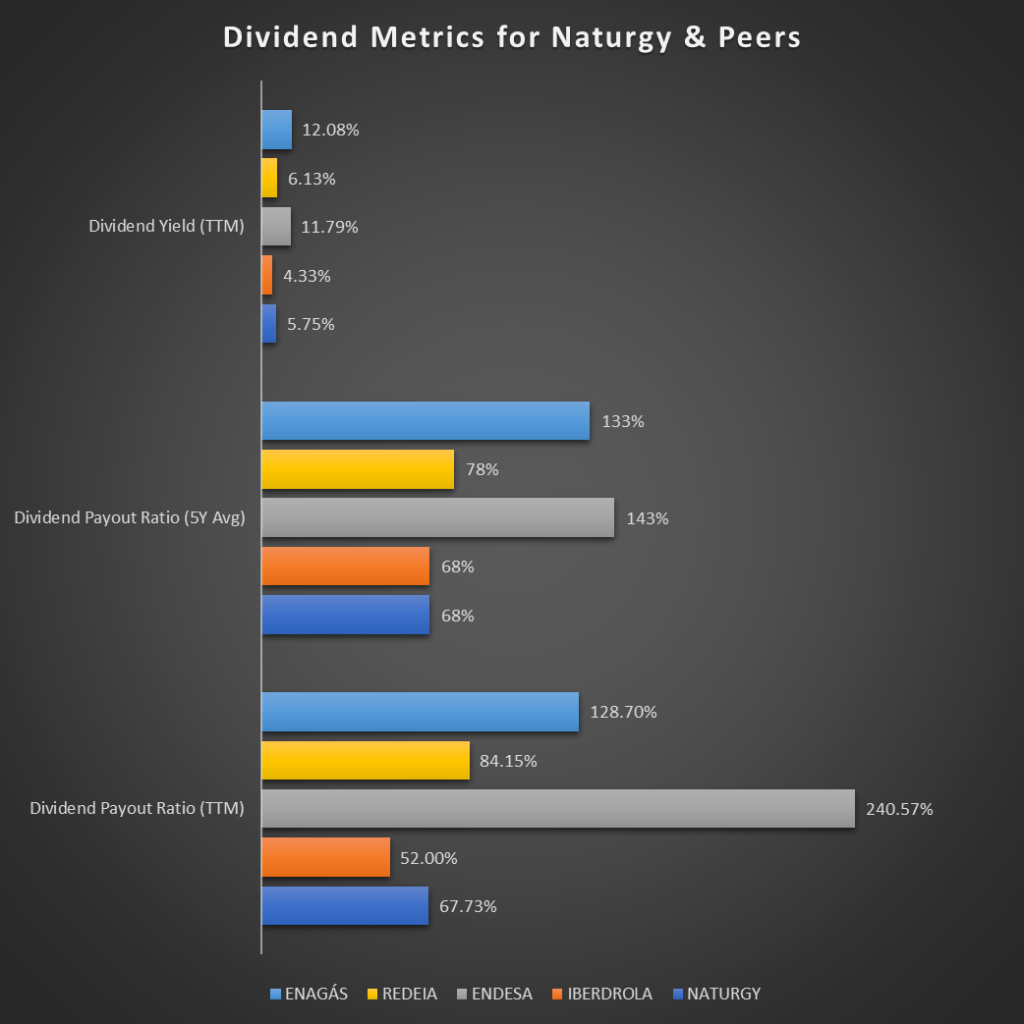
In the trailing twelve months (TTM), Naturgy had a dividend payout ratio (DPR) of 67.73%, while its peers ranged between 52% (Iberdrola) and 240.57% (Endesa). Iberdrola’s DPR is healthy, while Naturgy’s is high. However, Redeia’s DPR is very high, Enagas’ is unsustainable, and Endesa’s is very unsustainable.
Moreover, in the past 5-years, Naturgy and Iberdrola have both had a high average DPR of 68%. Their peers range between 78% (Redeia, i.e., very high) and 143% (Endesa, i.e., unsustainable).
On the dividend yield front, in the TTM, Naturgy has a 5.75% dividend yield in a peer range between 4.33% (Iberdrola) and 12.08% (Enagas). That compares favourably considering Naturgy’s dividend payout ratio against its highest-yielding peers, Enagas (12.08%) and Endesa (11.79%).

Comparing each company’s dividend payout ratio in the trailing twelve months (TTM) to its 5-year average dividend payout ratio, Naturgy’s dividend payout ratio is unchanged. Also, Iberdrola and Enagas’ dividend payout ratios fell by 24% and 3%, respectively. On the other hand, Endesa and Redeia’s dividend payout ratios rose by 68% and 8%, respectively.
Moreover, assessing each business’ dividend payout ratio (TTM) relative to the average peer dividend payout ratio (TTM), Naturgy’s dividend payout ratio is 41% lower. Iberdrola and Redeia’s dividend payout ratios are also 55% and 27% lower than the peer average. On the other hand, Endesa and Enagas’s dividend payout ratios are 110% and 12% higher than the peer average, respectively.
Lastly, evaluating each company’s dividend yield in the trailing twelve months (TTM) relative to the top average of 25% of the highest-yielding Spanish stocks, Naturgy’s dividend yield matches the average. Whereas Iberdrola’s dividend yield is 25% lower, and Enagas (by 110%), Endesa (by 105%), and Redeia (by 7%) are higher.
So, Naturgy has paid a high dividend in the last twelve months and over the past 5-years. It is not the highest-yielding among its peers, but those yielding higher have very high to unsustainable payout ratios. Moreover, its dividend yield matches the average of the top 25% Spanish dividend payers.
Growth
How rapidly is Naturgy expanding its sales, earnings, and assets? Is the company reducing its debt and expenses? Has Naturgy been able to reward shareholders with growing dividends over time? To answer these questions, I assessed the company and its competitors’ earnings before interest, tax, depreciation and amortization (EBITDA), earnings per share (EPS), revenue, dividend, capital expenditure (CAPEX), and debt growth rates.
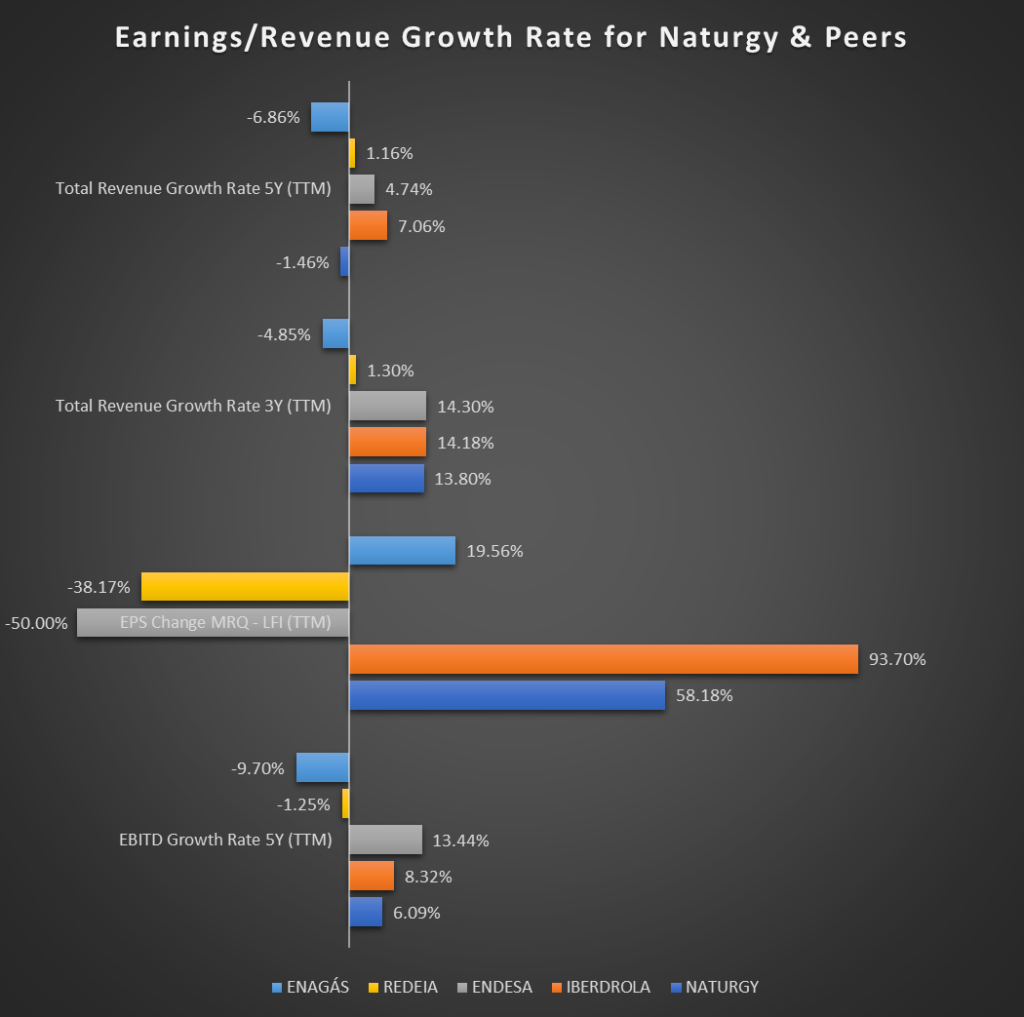
In the trailing twelve months (TTM), Naturgy had the third-highest 5-year EBITDA growth rate (6.09%) among its peers, which ranged between -9.7% (Enagas) and 13.44% (Endesa). Also, in the most recent quarter, the company had the second-highest EPS increase (58.18%) on a TTM basis, in a peer range of -50% (Endesa) to 93.7% (Iberdrola).
On a TTM basis, Naturgy had the third-highest 3-year total revenue growth rate (13.8%) among its, which ranged between 14.3% (Endesa) and -4.85% (Enagas). However, the company had the second-lowest 5-year total revenue growth rate (-1.46%), in a peer range of -6.86% (Enagas) to 7.06% (Iberdrola).
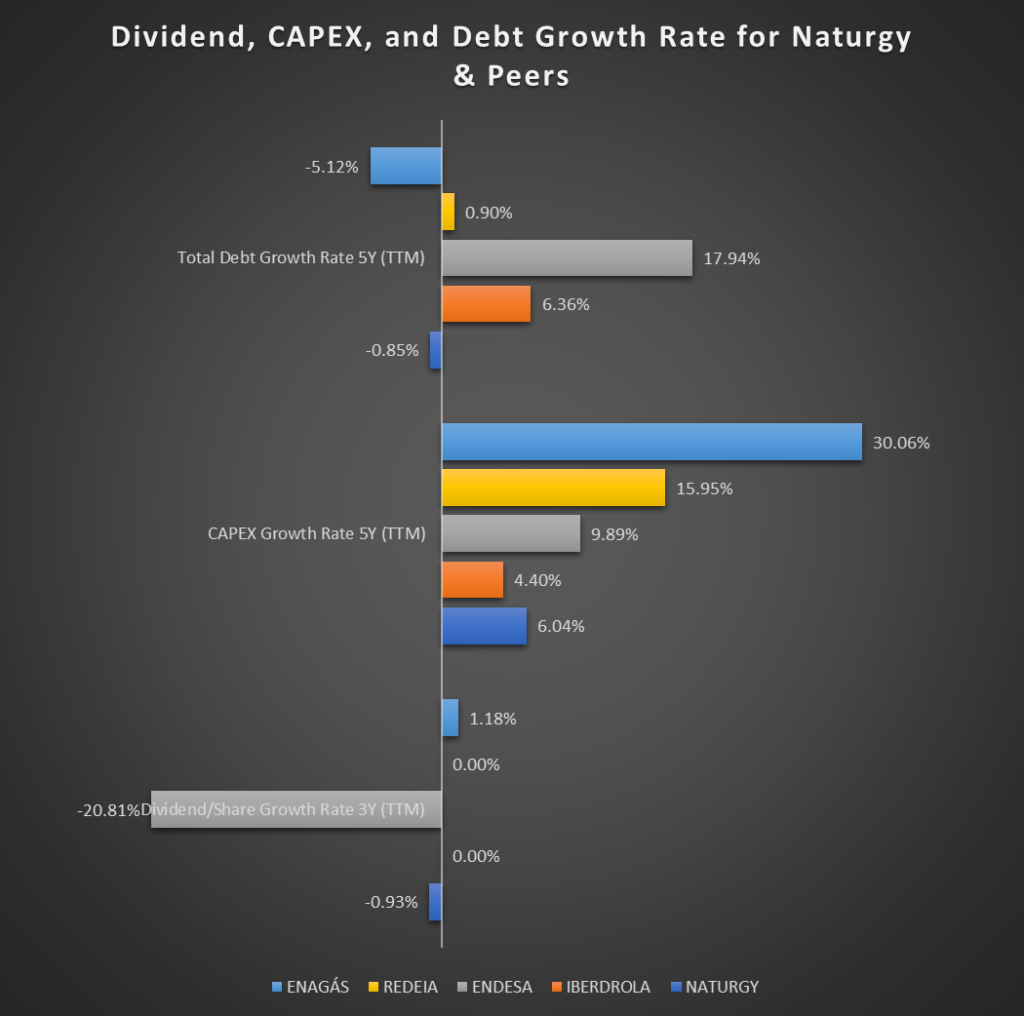
In the trailing twelve months (TTM), Naturgy and its peers had relatively flat 3-year dividend growth rates ranging between -0.93% (Naturgy) to 1.18% (Enagas). That excludes Endesa, which had a 20.81% dividend cut. Also, in the TTM, Naturgy had the second-lowest 5-year CAPEX rise (6.04%), in a peer range of 4.4% (Iberdrola) to 30.06% (Enagas). Lastly, in the TTM, Naturgy had the second lowest 5-year total debt growth rate (-0.85%) among its peers, which ranged between -5.12% (Enagas) and 17.94% (Endesa).
So, Naturgy’s earnings growth over the last 5-years and in the most recent quarter is positive and competitive among its peers. Also, its revenue growth may have been weak over the last 5-years, but its 3-year numbers show that it has turned the story around. Moreover, in the previous 3-5 years, Naturgy has slightly reduced dividends and total debt while keeping a firm grip on CAPEX growth.
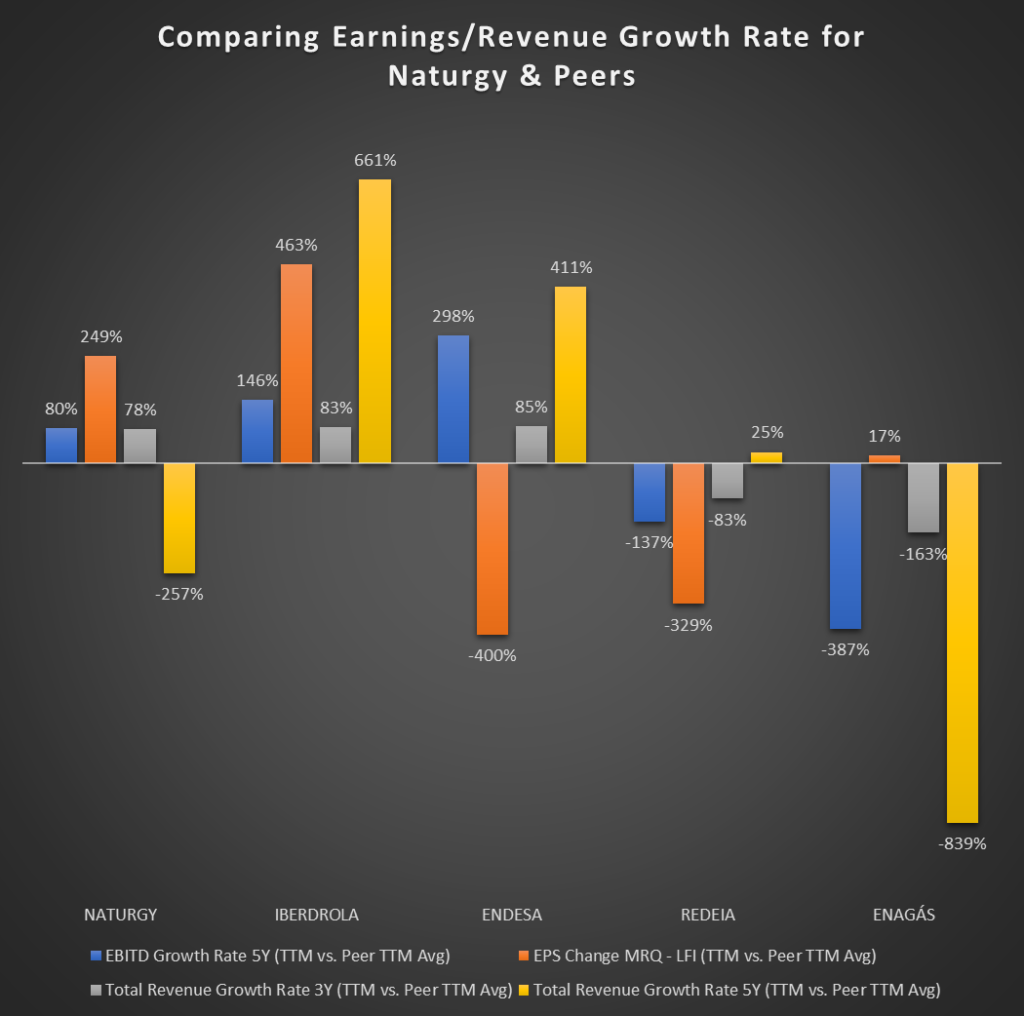
Comparing each company’s 5-year EBITDA growth rate in the trailing twelve months (TTM) to the average peer 5-year EBITDA growth rate (TTM), Naturgy is 80% above the peer average. Also, the firm lags behind Endesa and Iberdrola, which are 298% and 146% above the peer average. However, it leads Redeia and Enagas, which are 137% and 387% below the peer average.
Evaluating each business’ EPS change in the most recent quarter (MRQ) relative to the average peer 5-year EPS change (MRQ), Naturgy is 249% above the average. The company trails Iberdrola, which is 463% above the average. However, it leads Enagas, which is 17% above the average. Moreover, Naturgy also leads Redeia and Endesa, which are 329% and 400% below the peer average.
Assessing each firm’s 3-year total revenue growth rate in the trailing twelve months (TTM) relative to the average peer 3-year total revenue growth rate (TTM), Naturgy is 78% above the peer average. The company lags behind Endesa and Iberdrola, which are 85% and 83% above the average. However, it leads Redeia and Enagas, which are 83% and 163% below the average.
Comparing each company’s 5-year total revenue growth rate in the trailing twelve months (TTM) to the average peer 5-year total revenue growth rate (TTM), Naturgy is 257% below the peer average. The firm lags behind Iberdrola, Endesa, and Redeia, which are 661%, 411%, and 25% above the average. However, it leads Enagas, which is 839% below the average.
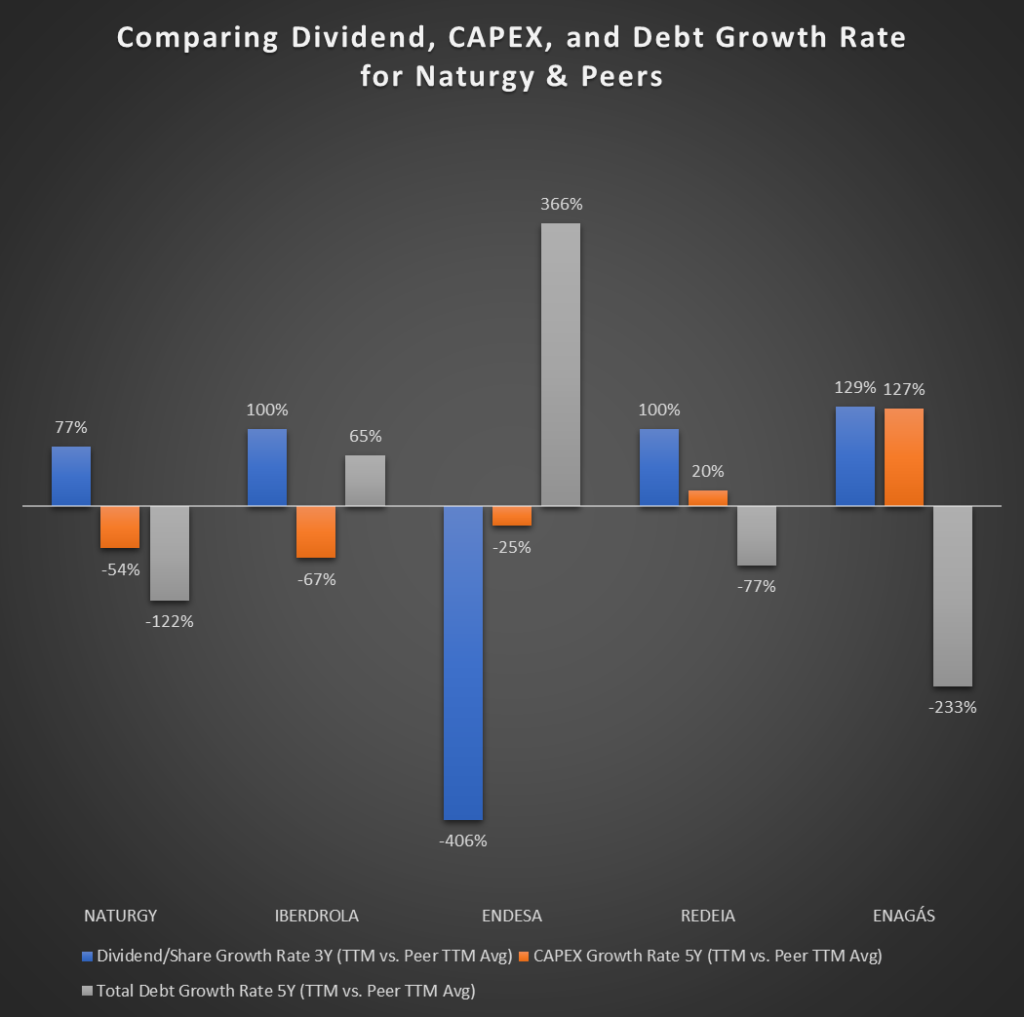
Comparing each company’s 3-year dividend per share growth rate in the trailing twelve months (TTM) to the average peer 3-year dividend per share growth rate (TTM), Naturgy is 77% above the peer average. The firm lags behind Enagas, Redeia, and Iberdrola, which are 129%, 100%, and 100% above the average. However, it leads Endesa, which is 406% below the average.
Evaluating each business’ 5-year CAPEX growth rate (TTM) relative to the average peer 5-year CAPEX growth rate (TTM), Naturgy is 54% below the peer average. The company leads Enagas and Redeia, which are 127% and 20% above the average. It also leads Endesa, which is 25% below the average. However, it lags behind Iberdrola, which is 67% below the average.
Assessing each firm’s 5-year total debt growth rate (TTM) relative to the average peer 5-year total debt growth rate (TTM), Naturgy is 122% below the peer average. The company leads Endesa and Iberdrola, which are 366% and 65% above the average. It also leads Redeia, which is 77% below the average. However, it lags behind Enagas, which is 233% below the average.
So, Naturgy’s EBITDA and EPS growth rates over the last 5-years are well above the peer average. Although its revenue growth over the previous 5-years falls short of the peer average, it has improved on that in the last 3-years, where its revenue growth rate is nearly double the peer average. Moreover, Naturgy’s dividend per share growth rate is above the peer average, and its CAPEX and debt growth rates are well below the peer average.
Fundamentals Summary
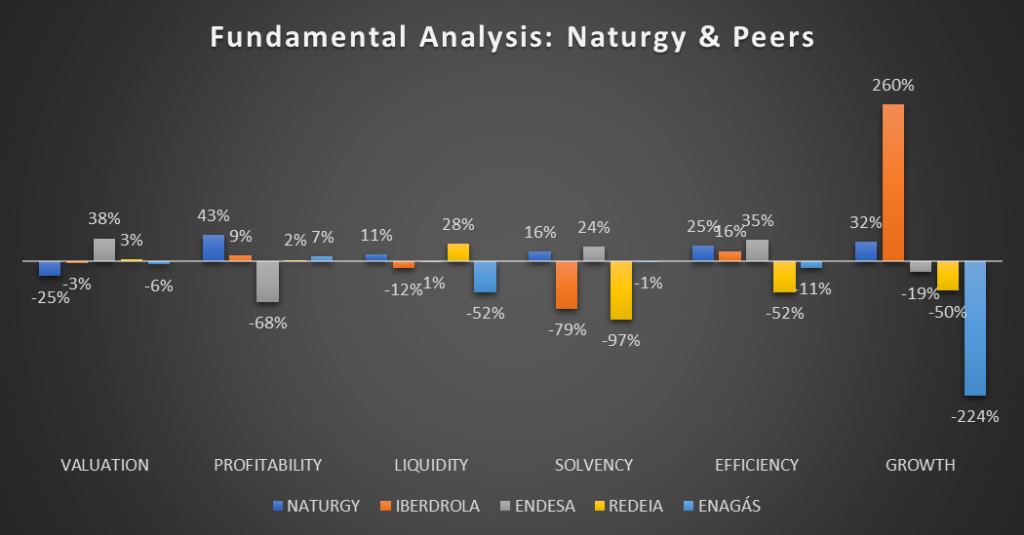
Following my fundamental analysis of Naturgy and its competitors, here are the key points based on averaging the comparative percentages of the analyzed business metrics:
- Valuation – Naturgy has the best valuation metrics among its peers, with a 25% overall score, trailed by Enagas at 6%. This conclusion is based on PE and PCF ratios.
- Profitability – Naturgy has the best profitability metrics among its peers, with a 43% overall score, trailed by Iberdrola at 9%. This decision is based on ROA, ROE, ROI, gross and net profit margins, earnings per share (EPS, excluding extraordinary items), and revenue per share.
- Liquidity – Naturgy has the second-best liquidity metrics among its peers, with an 11% overall score, trailing Redeia’s 28%. This result is based on current and quick ratios.
- Solvency – Naturgy has the second-best solvency metrics among its peers, with a 16% overall score, trailing Endesa’s 24%. This conclusion is based on total debt to equity, total debt to asset, long-term debt to equity, and interest coverage ratios.
- Efficiency – Naturgy has the second-best efficiency metrics among its peers, with a 25% overall score, trailing Endesa’s 35%. This decision is based on asset, inventory, and receivables turnover ratios.
- Growth – Naturgy has the second-best growth metrics among its peers, with a 32% overall score, trailing Iberdrola’s 260%. This result is based on EBITDA, EPS, total revenue, revenue per share, dividend per share, capital expenditure, and total debt growth rates.
I believe it is safe to conclude that Naturgy Energy Group SA has rock-solid foundations. So, the company’s past and present are acceptable. What about its future?
Does Naturgy Have a Bright Future?
Whether a business has a prosperous future depends on its prospects of maintaining or growing net sales and income while cutting expenses. To make higher income, a company must be able to sell more goods and services (i.e., increase market share or customer base) or charge more for its products (i.e., improve margins). That is tougher to pull off than reducing expenses.
As seen earlier, 88% of Naturgy’s income mainly comes from selling natural gas (24%), electricity (23%), LNG (21%), and access to its gas distribution network (20%), primarily to its Spanish customers. On the other hand, 64% of the company’s total costs were incurred purchasing energy (mainly natural gas). The business’ prospects rest on increasing the former or decreasing the latter.
Naturgy’s Net Sales Outlook
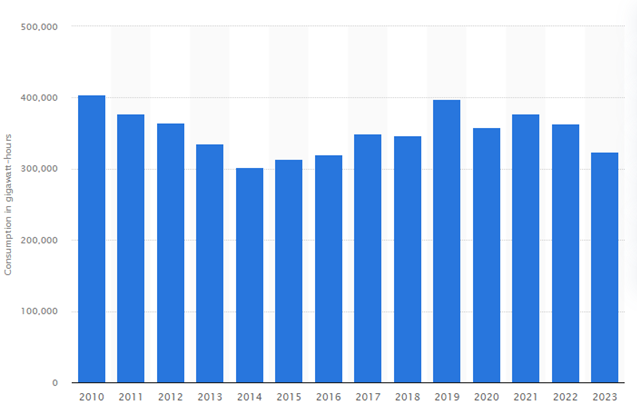
Per Statista, “In 2023, natural gas consumption in Spain stood at nearly 324 terawatt-hours, down from some 364 terawatt-hours in the previous year.” Spanish natural gas consumption has been declining since 2019. So, Naturgy’s largest customer base consumed 10.9% less gas in 2023.
Businesses and people consume energy, so the Spanish economy and population would need to crank up to see an increase in consumption. There is excellent news for Spain on the economic front:
- Eurostat projects that Spain’s economy will grow by 1.7% and 2% in 2024 and 2025, respectively. Beating the European Union’s projected average of 0.9% in 2024 and 1.7% in 2025.
- The rise in Spanish new employment was among the strongest in Europe in Q4 2023.
- In 2023, house prices in Spain rose 4.2%, surpassing that of other European markets.
- Retail sales in Spain surged 1.9% year-on-year in February 2024, marking the 15th consecutive annual increase.
- Spanish headline inflation is expected to moderate to 3.2% in 2024, slightly exceeding the European Union’s 3% average. That figure is projected to fall to 2.1% in 2025, compared to 2.5% for the European Union and 2% for the Eurozone. That bodes well for interest rate cuts.
- These numbers confirm that this economic growth surge was mainly driven by resilient domestic demand in the face of persistent inflationary pressures and elevated interest rates. Those headwinds are expected to weaken going forward.
- Based on this economic momentum, Moody’s revised the Spanish Government’s outlook to positive from stable in March 2024.
Spain also has terrific news on the population front. As they integrate easily into a shared culture and language, Latin Americans are increasingly immigrating to Spain. The Spanish technology and hospitality sectors have seen a significant rise in immigrants. This inflow of people to Spain is akin to what the U.S. is experiencing with the surge in immigrants under President Biden. However, Spanish immigration is essentially legal (documented immigrants with work permits), unlike in the U.S. The trend is virtuous since the more the Spanish economy improves due to the power boost from positive immigration, the more immigrants come, and on it goes.
Naturgy’s Profit Margin Outlook
Natural gas prices have fallen 64% from their previous peak in August 2022. That was after rising 104% between December 2021 and August 2022, following the outbreak of the Russo-Ukraine conflict in February 2022. Being one of the largest gas utilities in Europe and having LNG import terminals, Naturgy’s gas trading business’ profitability was boosted by surging gas prices in Europe during the energy crisis that followed the outbreak of war. However, the collapse in gas prices has seen Naturgy become one of 2024’s worst-performing utilities until recently.
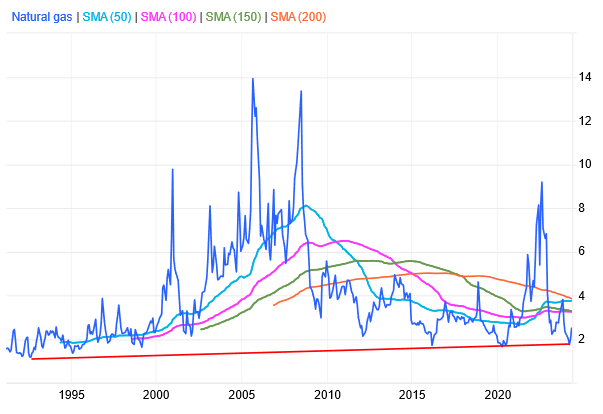
However, as seen on the price chart’s trendline (i.e., the red line), natural gas prices have recently re-tested the lows of the previous seven major bottoms and are in recovery. The 50, 100, 150, and 200-day simple moving averages indicate a price range between 3.3 and 3.8 USD/MMBtu. If the market returns to the mean, natural gas prices will increase by 32% to 52%. That should significantly improve Naturgy’s profitability.
Moreover, Spanish Royal Decree-Law 8/2023 of 27 December, aimed at mitigating the effects of the energy crisis (and the drought of 2022) by limiting the increase in raw material costs included in the tariff of last resort for natural gas to 15%, expires on 30 June 2024. Naturgy’s profit margins should benefit from this, as well as other inflation mitigation measures elapsing as high inflation wanes. Also, the allowed returns of Spanish electricity networks are expected to increase in 2026.
Naturgy’s Risks and Opportunities
Naturgy is unique among European utilities because of its low free-floating shares of just 13%. That led to its removal from several MSCI indices on the last trading day in February 2024, per MSCI free float rules. While having nothing to do with the business fundamentals, this event led to a 17% fall in share price between the delisting announcement on 13 February and the appearance of chatter of a takeover by Abu Dhabi’s power and water utility, Taqa, in mid-April.
On April 17, Taqa confirmed it was holding talks with Naturgy’s three largest shareholders – Criteria Caixa (27%), CVC (20%), and Global Infrastructure Partners (20%) – to buy their stakes to launch an acquisition bid. Taqa would also have to buy out the Australian fund IFM, which holds a 15% stake in Naturgy. IFM’s stake is the most recently purchased of the bunch, and its purchase price is likely around EUR 24 per share, given when it bought its stake. So, per Morningstar’s Tancrede Fulop, a takeover offer price should be around EUR 28 per share for IFM to exit with a 10% annualized return, plus dividends. That suggests a 14% upside from the current share price.
Morningstar’s Tancrede Fulop expects renewables to be Naturgy’s main growth engine through 2028 as the company lags behind its peers in renewables exposure. Due to an inflationary and high-interest rate environment, Naturgy risks overspending on its attempts to catch up. In fact, in July 2023, the firm cut its 2021 goal of raising its renewables capacity from 4.6 GW in 2020 to 14 GW in 2025 and now plans to reach 10 GW in 2025. Naturgy’s responsiveness to this risk of ballooning costs is good news for shareholders.
Naturgy’s dividend floor of EUR 1.4 through 2025 suggests a payout ratio of 80% while increasing investments. That is more sustainable than the 120% average payout ratio it paid between 2018 and 2022. It also suggests expanding dividends from the current 67% payout. Moreover, this reallocation of capital from dividends to growth investments bodes well for shareholders in the long run.
Lastly, Naturgy faces emerging market risks. The firm has foreign currency exchange and political risk from its considerable exposure to Latin American countries. Moreover, its gas procurement relies heavily on Algeria (38%) and Nigeria (15%), both countries with above-average political risk.
What Does All This Suggest I Do About Naturgy Stock?
First, some important housekeeping. What follows is strictly my personal opinion and is in no way to be construed as advice to others consuming this information. Do your own due diligence and research and reach your own conclusions. For all intents and purposes, these thoughts are for educational or entertainment purposes.
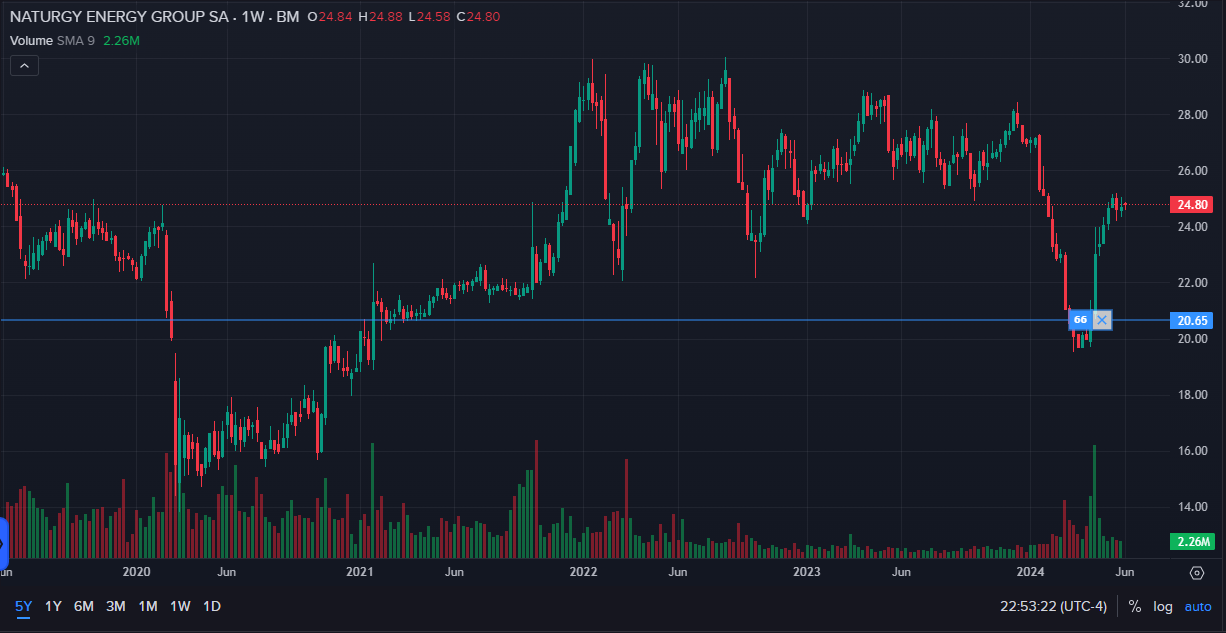
Given the preceding analysis of Naturgy’s business, should I buy, sell, or hold its shares? For Naturgy, the decision is straightforward. I would buy the stock if I had not already done so. With my entry price of EUR 20.6, I am already up 20%, and I will not be adding more shares to my position.
The business has stellar metrics across the board and pays a high and sustainable dividend. Its share price still has some room to run if its valuation returns to the mean. There is also a potential 14% upside from an acquisition by Taqa.
Moreover, tailwinds from diminishing inflation and interest rates, the removal of inflation protection measures and rise in distribution tariffs, the booming Spanish economy and immigration, and recovering natural gas prices suggest a promising future for the company.
