APA Group, a leading Australian energy infrastructure company, released its first-half (July to December) fiscal year 2025 (1H25) earnings report on February 23, 2025. The report highlighted a strong operational performance amidst a dynamic energy market. It underscores APA’s ability to balance its traditional gas business with emerging renewable opportunities and Australia’s evolving energy demands.
APA’s 1H25 Earnings Report Highlights
Key financial highlights include (note that comparative changes are relative to 2024’s figures):
Revenue Growth
Revenue excluding pass-through costs increased by 7.1% to $1,364 million, driven by strong gas transmission volumes and contributions from the newly integrated Pilbara Energy acquisition.
Pass-through fees are costs that utility companies like APA Group charge to their customers to cover expenses incurred for things beyond their control (e.g., fees they paid for using municipal land and infrastructure to deliver electricity and gas). These fees subject to regulatory approval before companies can pass them on to the customers.
EBITDA Boost
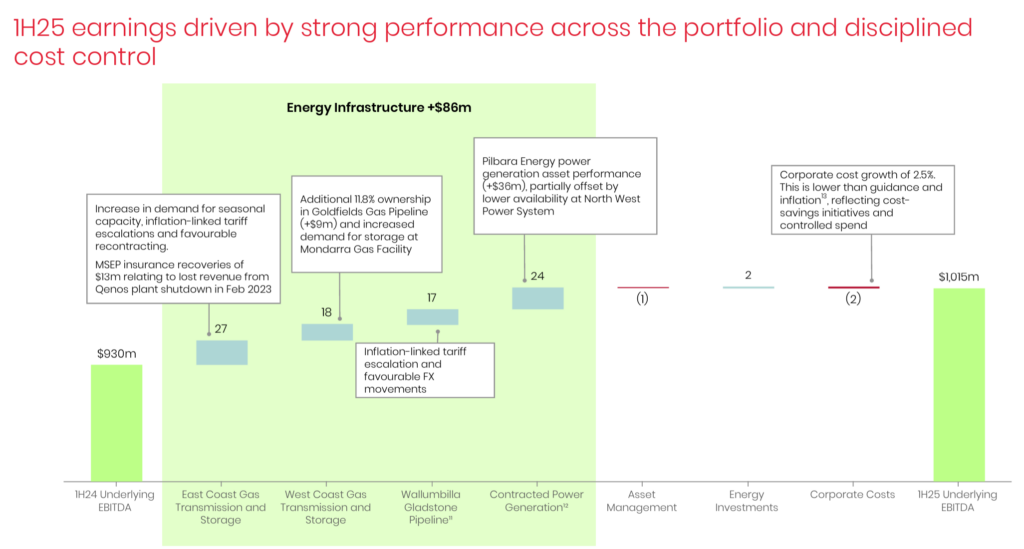
Underlying EBITDA rose 9.1% to $1,015 million, underlying EBITDA margin rose 1.3% to an excellent 74.5%, and free cash flow (FCF) increased by 3.6% to AUD 552 million. The firm also reaffirmed its full FY25 (fiscal year 2025) underlying EBITDA guidance of AUD 1.96 to 2.02 billion.
These results reflect APA’s operational efficiencies (e.g., the 1H25 underlying EBITDA included an AUD 31 million rise in inflation-linked tariff escalation; 90% of APA’s revenues are inflation-linked), effective cost management (e.g., the 2.5% corporate cost growth, to AUD 81 million, seen in 1H25 was below inflation), and higher asset utilization from successfully integrating newly acquired assets.
Underlying earnings before interest, tax, depreciation, and amortisation (“Underlying EBITDA”) excludes recurring items arising from other activities, transactions that are not directly attributable to the performance of APA Group’s business operations and significant items
Integrating Pilbara Energy assets in Western Australia significantly boosted earnings, strengthening APA’s position in a resource-heavy region. In 1H25, APA’s underlying EBITDA included an AUD 45 million boost from the Pilbara Energy System (compared to 1H24).
Capital Expenditure Discipline
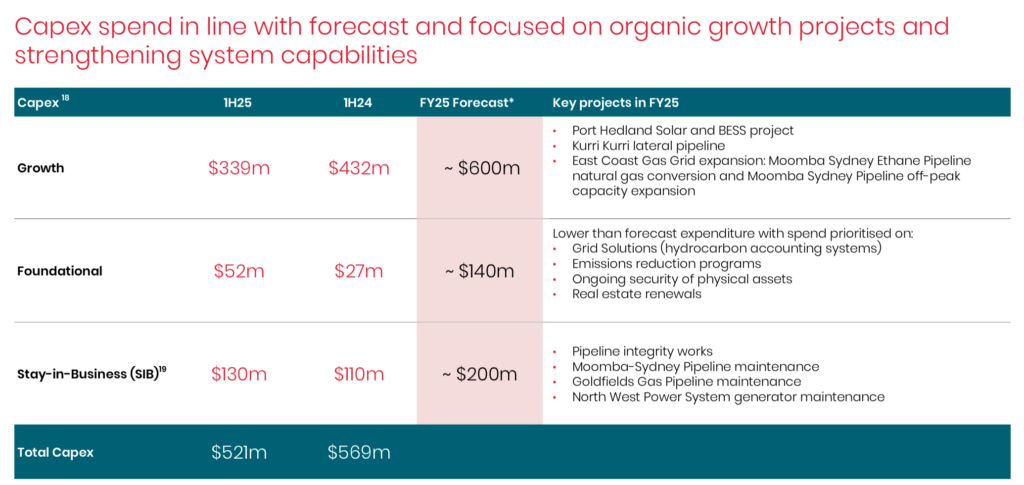
APA continued investing in infrastructure upgrades (aimed at enhancing network reliability) and renewable energy projects, aligning with long-term decarbonization goals. The company reported AUD 521 million of capital expenditure (CapEx), down 8.4% compared to 1H24. Most (65%) of that spending went to growth projects (e.g., Port Hedland Solar and BESS, Kurri Kurri lateral pipeline and the East Coast Gas Grid expansion projects), and 24% went to infrastructure integrity and maintenance (i.e., strengthening system capabilities).
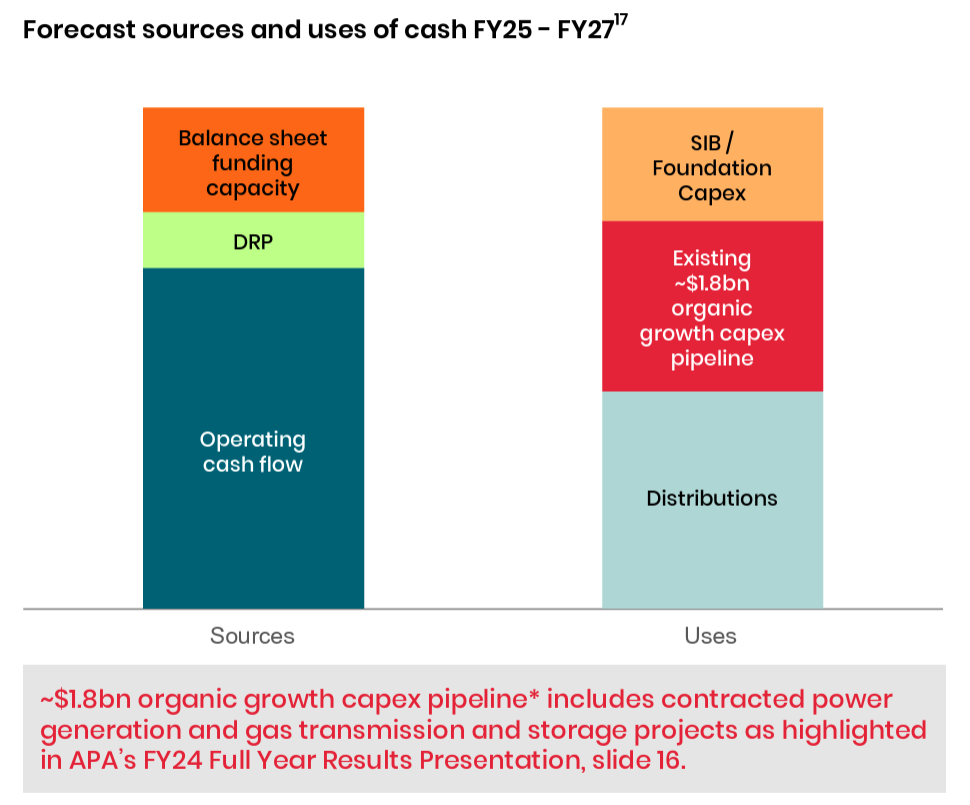
On the APA’s 1H25 earnings call, CFO Garrick Rollason stated, “Apart from the DRP, APA does not need to issue ordinary equity to fund the identified organic growth pipeline of AUD 1.8 billion over FY25 to FY27… The inflation-linkage of our tariffs, participation in the DRP, and the dividend payout ratio provide up to AUD 700 million of capital expenditure funding per annum, which is above our estimated growth CapEx of circa AUD 600 million per annum.“
So, APA confirmed they have ample capacity to fund the approx. AUD 1.8 billion organic growth pipeline over FY25-27 through operating cash flow, existing balance sheet capacity and DRP (distribution reinvestment plan, which already has positive shareholder buy-in). Moreover, APA confirmed significant existing balance sheet capacity and ongoing growth in operating cash flow to provide additional funding capacity.
Distribution Sustainability
APA maintained its commitment (to sustainable distribution growth) to shareholders. The company raised its DPS (distribution per security) by 1.9% for 1H25 and reaffirmed its FY25 DPS increase of 1.8% (amounting to a dividend yield of 7.43% on 15th March’s AUD 7.67 share price). Also, the company’s distribution payout ratio decreased by 0.8% and now stands at 63.4%.
On APA’s 1H25 earnings call, management provided several key insights into their approach to dividends and shareholder distributions as part of their capital allocation strategy:
- Commitment to Shareholder Returns: CEO Adam Watson highlighted APA’s focus on returning capital to shareholders, stating, “We’re focused on initiatives that will maximize securityholder returns. This includes cost reduction initiatives and delivering new growth projects that generate returns well above our cost of capital.“
- Sustainability of Distribution: CEO Adam Watson reassured investors by stating, “We deliver an attractive distribution yield, supported by a track record of both growing distributions and investing in growth. And we have a strong balance sheet with numerous funding options to support our growth… Having done the work to strengthen our foundations, we’re confident in our ability to deliver sustainable growth, including sustainable distribution growth… We have an attractive distribution yield of 8.5%, and we’re focused on sustainable distribution growth for security holders over the long term.”
Optimizing Interest and Finance Costs and Debt
Compared to 1H24, APA’s profit before income tax suffered a 92.6% collapse to AUD 83 million due to a 58.5% rise in net interest and other finance costs, which ballooned to AUD 412 million. This decline was despite a 22.2% increase in EBIT (earnings before interest and tax) to AUD 495 million.
The spike in net interest and other finance costs was mainly due to foreign exchange losses from the termination of the Wallumbilla Gladstone Pipeline hedge relationship (an AUD 83 million hit). Moreover, the increase in net debt due to refinancing activities in 1H25 (an AUD 35 million rise) and interest on the company’s hybrid subordinated capital securities and syndicated term loans (an AUD 30 million rise) also played a notable part.
On APA’s 1H25 earnings call, management discussed their intention to tackle costs through a combination of active capital management, enterprise-wide cost reductions, and APA’s predictable capacity-based inflation-linked revenues.
- Focus on Cost Base: CEO Adam Watson stated, “In addition to growth, we’re focused on what we can control, such as our cost base. We’re confident we can deliver meaningful reductions in our cost base across operations, our corporate functions, foundational CapEx and our stay-in-business CapEx. Our discipline extends to our funding arrangements… We’re continually reviewing our portfolio to identify opportunities for asset recycling.“
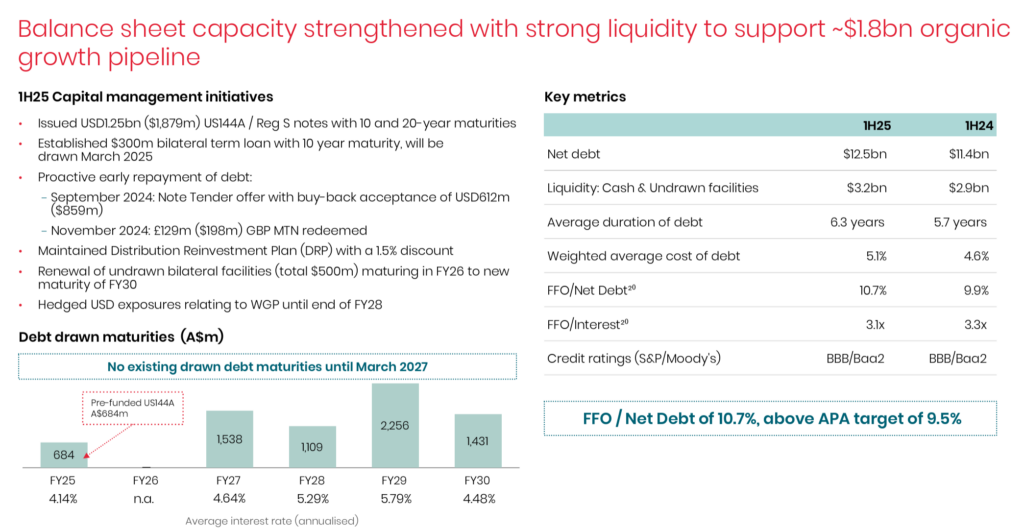
- Debt Funding Capacity: CFO Garrick Rollason stated, “We now have no existing drawn debt maturities until March 2027… Funds from operations (FFO) to net debt at December was 10.7%, above our target of 9.5%… This metric supports debt funding capacity at the half-year of around AUD 1.6 billion… This metric remains consistent with our BBB/Baa2 credit ratings and is in line with the rating agency’s expectations. As we’ve said previously, we remain committed to our current investment-grade credit ratings.“
APA’s Investment Thesis and Market Reaction to Earnings
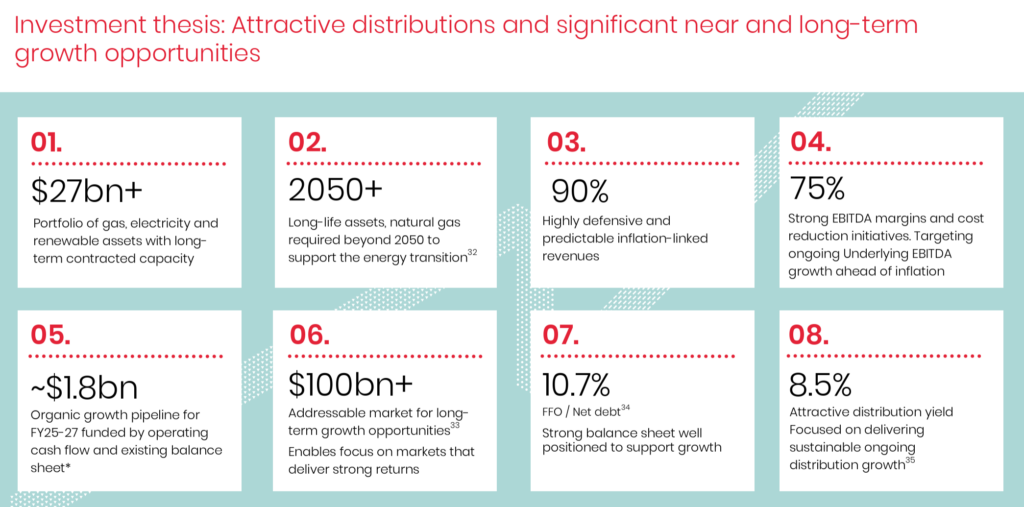
Attractive distributions and significant near and long-term growth opportunities.
- Over AUD 27 billion portfolio of gas, electricity and renewable assets with long-term contracted capacity.
- Long-life assets, with natural gas forecasted to be required beyond 2050, to support the energy transition.
- Highly defensive and predictable inflation-linked revenues (90% of total revenues).
- Strong EBITDA margins (75%) and cost reduction initiatives. Targeting ongoing Underlying EBITDA growth ahead of inflation.
- AUD 1.8 billion of organic growth pipeline for FY25-27 funded by operating cash flow and existing balance sheet.
- AUD 100 billion addressable market for long-term growth opportunities. Enables focus on markets that deliver strong returns.
- Attractive distribution yield (7.43% as of March 15, 2025). Focused on delivering sustainable ongoing distribution growth.
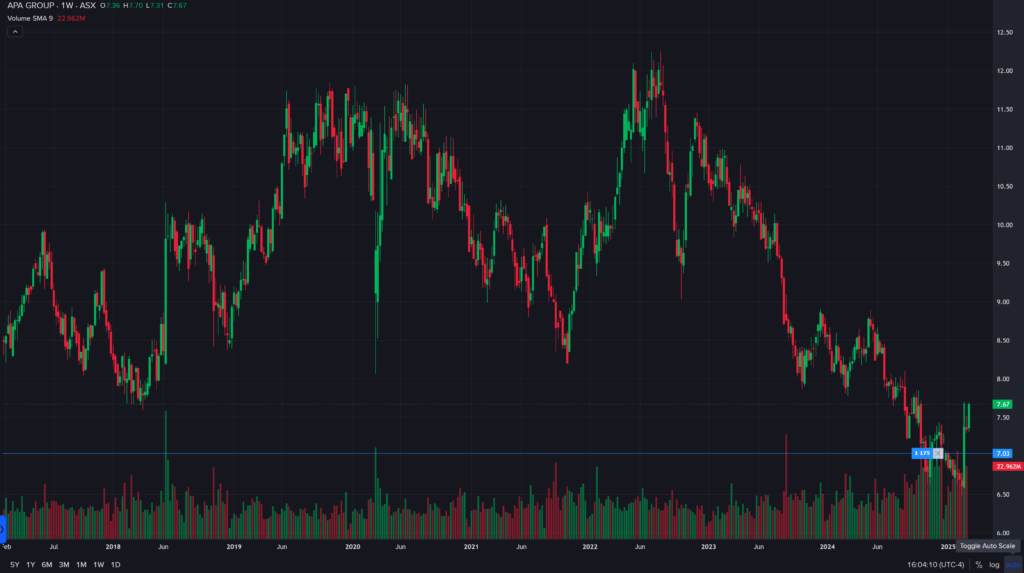
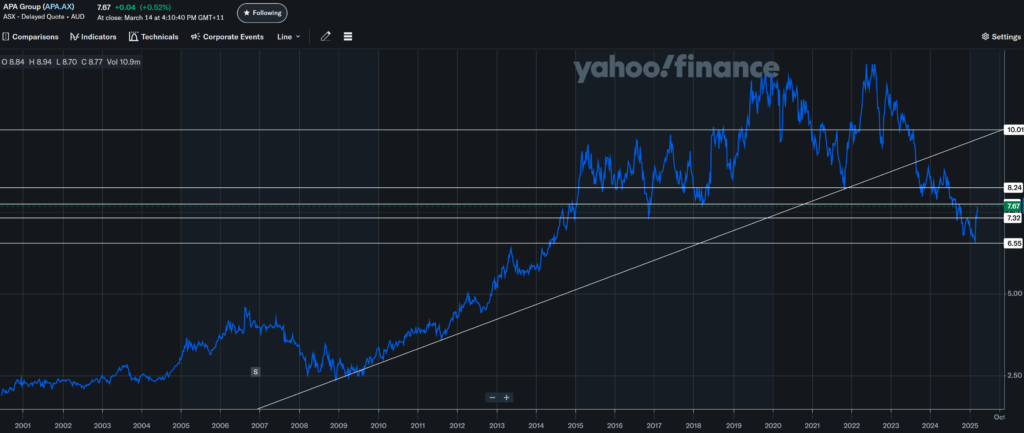
The market’s reaction to APA Group’s first-half (July to December) fiscal year 2025 (1H25) earnings report, released on February 23, 2025, has been positive. The company’s shares, trading on the Australian Stock Exchange (ASX), have risen 17% since the earnings release.
APA’s Outlook: Local and National Political Dynamics
Election Calendar and Political Context
The Australian federal election, due by May 17, 2025, pits Prime Minister Anthony Albanese’s Labor Party (incumbent, 78 seats in 2022) against Opposition Leader Peter Dutton’s Liberal/National Coalition (56 seats). Polling (Roy Morgan, February 17-23, 2025) shows Labor at 51% and the Coalition at 49% two-party-preferred, suggesting a close contest. Energy policy is a flashpoint, with Labor pushing renewables and the Coalition favouring gas as a transition fuel.
- Incumbent (Labor): Labor’s renewable energy agenda (43% emissions cut by 2030) supports APA’s growing renewable segment, though its gas market interventions (e.g., price caps) could squeeze gas transmission margins.
- Opposition (Coalition): The Coalition’s pro-gas stance benefits APA’s core business but may slow renewable funding, impacting long-term diversification.
Revenue Breakdown and Political Implications
APA’s revenue split (based on historical trends and 1H25 inferences) is approximately 70% from gas transmission and related services (e.g., pipelines, storage) and 30% from energy solutions, including renewables (e.g., power generation, hydrogen projects).
- Incumbent (Labor): Labour’s policies could accelerate APA’s renewable growth (30% segment), potentially lifting it to 35-40% by 2030, but gas price caps might erode the 70% gas revenue base.
- Opposition (Coalition): A Coalition win would bolster the gas segment in the short term, delaying renewable expansion and keeping the split stable. The tight election adds uncertainty, but APA’s balanced portfolio offers flexibility.
APA’s Outlook: Natural Gas Price and Demand Projections
Current Context and Historical Data
On February 24, 2025, East Coast gas prices (Wallumbilla Hub) are AUD 12-14/GJ, driven by LNG export demand, while Pilbara prices are AUD 10-13/GJ, tied to mining activity. Prices peaked at AUD 20+/GJ in 2022 but stabilized in 2023-2024.
Expert Projections
- Short-Term (2025): Australian Energy Market Operator (AEMO) forecasts East Coast prices at AUD 12-15/GJ, with Pilbara steady at AUD 10-13/GJ, buoyed by industrial demand.
- Long-Term (2026-2030): The IEA predicts a decline to AUD 8-10/GJ as renewables grow, though domestic caps could hasten this.
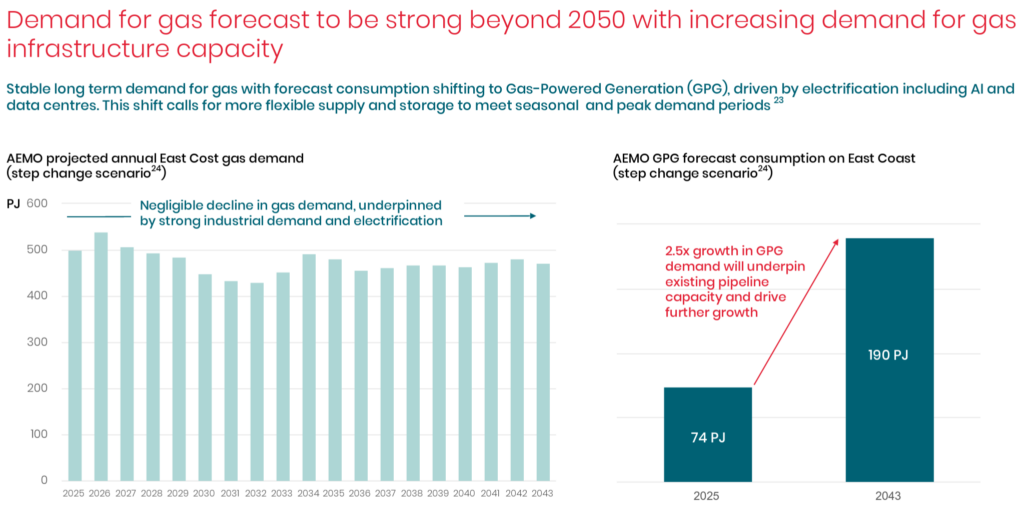
- Demand Picture: The AEMO projects a negligible decline in gas demand between 2025 and 2043, underpinned by strong industrial demand and electrification.
Impact on APA
With 70% of revenue gas-driven, firm 2025 prices support APA’s earnings, especially in Pilbara. A long-term drop threatens this segment, pushing reliance on the 30% renewable stream, which trails competitors like AusNet in scale. However, APA is expected to grow its renewables segment over the long term, denting the impact of this projected long-term gas price decline.
APA’s Outlook: Interest Rates and Debt
RBA Decisions and Expectations
The Reserve Bank of Australia (RBA) cut the cash rate to 4.10% on February 18, 2025, from 4.35%, with inflation at 2.4% (December 2024). Rates had remained at 4.35% since November 8, 2023, following a torrent of rate hikes from 0.1% beginning on May 4, 2022.
- 2025 Outlook: Rates may hold at 4.10% through mid-2025, possibly dropping to 3.85% by year-end (ING forecast).
- Long-Term: A 3-3.5% neutral rate is expected by 2026.

Debt-to-Equity Ratio
APA’s debt-to-equity ratio is approximately 5.1:1 as of 1H25 (total debt AUD 13.8 billion, equity AUD 2.8 billion), up from 4.0:1 in 2024. Compared to competitors Jemena (1.5:1) and AusNet (1.6:1), APA’s leverage is higher, reflecting its capital-intensive model.
Impact on APA
Lower rates bolster APA’s ability to service debt and fund capex, supporting solvency. Its higher leverage versus peers remains a risk if rates rise or revenues falter. Given the current RBA moves and expected interest rate cuts, APA’s financial position will benefit.
What Does All This Suggest I Do About APA Group’s Stock?
First, some important housekeeping. What follows is strictly my personal opinion and is in no way to be construed as advice to others consuming this information. Do your due diligence and research and reach your conclusions. For all intents and purposes, these thoughts are for educational or entertainment purposes.
Given the preceding discussion of APA’s first-half (July to December) fiscal year 2025 (1H25) earnings report, investment thesis, and outlook (including political, commodity price, and interest rate dynamics), should I buy, sell, or hold APA’s shares? It’s a complicated situation mainly due to the company’s net debt and cost base.
However, taking the sum of the latest earnings report and macro-economic factors, I would buy the stock if I had not already done so. With my entry price of AUD 7.02, I am already up 9.26% (excluding the 7.43% dividend yield), and I will likely not be adding more shares to my position.
